
Summary View
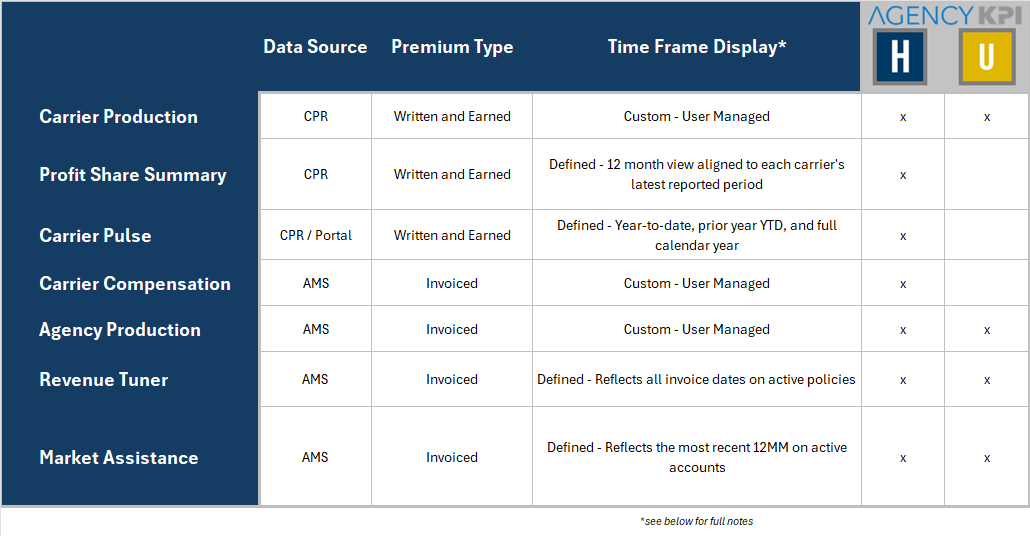
The table below provides a summary view of available reports, including their data source, premium type, and timeframe. Use this snapshot as a quick reference before exploring the detailed explanations further down the page.
Details
The following sections provide detailed definitions, use cases, and reconciliation notes for each report. Refer here when you need a deeper understanding of how the metrics are sourced and displayed.
📊 Data Sources
-
Carrier Production Reports
-
Carrier Production is the detailed view of carrier production data, sourced directly from carrier-reported files.
💲 Premium Type
-
Written Premium (CPR)
-
Earned Premium (CPR)
🕒 Time Frame Display
- User-managed timeframe: You can choose the period using the Time Frame Selector.
- Flexible display: Because you control the timeframe, you also control how many months are displayed — anywhere from a single month to multiple years.
- When you make a selection, all carriers are included in the results — even if some carriers do not have data in the chosen timeframe. This means comparisons may not always be uniformly comparable if certain carriers are behind on reporting. To refine the view, use the Hide Incomplete option to remove carriers with missing data.
🎯 Use Cases
For Executive Planning & Strategy
-
Support quarterly business reviews and strategic planning for executives by surfacing clean, comparative production data by carrier and agency
-
Compare agency-reported vs carrier-reported production
For Performance Monitoring & Review
-
Monitor growth by line of business or carrier
-
Support performance review discussions
💡 Notes & Tips
-
Filter by agency, carrier, or line of business (LoB)
-
Use Collaboration Mode to hide other agencies during meetings
-
Use the “Complete” or “Hide Incomplete Data” toggle to remove carriers with partial data and avoid gaps
-
Switch between multiple view modes: Carrier, Agency, or Broad LoB
⚖️ Reconciliation Notes
-
Written Premium may differ from Profit Share (Carrier Production aligns all results to the user-selected timeframe, while Profit Share aligns each row to the carrier’s last available month — meaning their totals will most likely not match).
-
Effective date vs booking date timing differences
📊 Data Sources
-
Carrier Production Reports
💲 Premium Type
-
Written Premium (CPR)
-
Earned Premium (CPR)
🕒 Time Frame Display
- Each row in the Profit Share table displays a trailing 12-month view as of the last month of data available for that specific Carrier. Because latest reporting varies by carrier, one row may display July–June while another shows June–May. In other words, the 12-month periods are aligned to each carrier's most recent update, not to a single uniform month as in the Carrier Production.
🎯 Use Case
-
Guide profit share eligibility reviews and bonus forecasting for finance or partner management teams by showing YTD growth and loss ratio performance
-
Track profit-sharing thresholds
-
Monitor performance metrics tied to carrier contracts
💡 Notes & Tips
-
Use Collaboration Mode to focus views
-
Filter by year, line of business (LoB), or carrier type
-
Focus on loss ratios and underwriting results
-
Leverage as a negotiation tool with carriers
⚖️ Reconciliation Notes
-
Written Premium may differ from Carrier Production (Profit Share aligns each row to the carrier’s last available month, while Carrier Production aligns all results to the user-selected timeframe — meaning their totals will most likely not match).
-
Earned Premium differs from written used in Carrier/Agency Production
-
Loss ratio definitions may vary by carrier
📊 Data Sources
-
Carrier Production Reports
-
Carrier Portal Reports
-
Carrier Pulse provides a high-level view of carrier production data, combining insights from carrier portals and carrier-reported files.
💲 Premium Type
-
Written Premium (CPR)
-
Earned Premium (CPR)
🕒 Time Frame Display
- Offers a flexible view of performance, including the current year-to-date, prior year YTD for comparison, and the full calendar year to capture longer-term trends.
🎯 Use Case
-
Accelerate time to value by giving immediate access to aggregated carrier data, as sourcing becomes available.
-
Provide a single view of carrier data across multiple formats—whether uploaded manually or integrated via detailed carrier reports
-
Enable early insights into carrier performance and trends, helping clients start conversations with carriers faster while also informing placement strategy and optimization.
💡 Notes & Tips
-
Upload carrier reports in any format (Excel, PDF, CSV, etc.) to quickly populate the page with data
-
Toggle between multiple views of carrier data: Best (the most complete view), AKPI (Carrier Production report sourced directly from the carrier, meeting the AKPI standard), Portal (downloaded report from the carrier portal), or Both (all data combined).
⚖️ Reconciliation Notes
-
When comparing sourced carrier files and portal downloads, discrepancies may occur.
-
If data does not align, first confirm that the carrier-sourced file includes all months represented in the portal download.
-
Customers can use the Carrier Data Health page to verify completeness and identify any missing months or gaps in reporting.
📊 Data Sources
-
Agency provided Production reports
-
Additional compensation may be manually entered
💲 Premium Type
-
Invoiced Premium (AMS)
🕒 Time Frame Display
- User-managed timeframe: You can choose the period using the Time Frame Selector.
- Flexible display: Because you control the timeframe, you also control how many months are displayed — anywhere from a single month to multiple years.
🎯 Use Case
-
Enable compensation reconciliation and revenue tracking for accounting or operations teams by aggregating base and contingent payments by carrier or agency.
💡 Notes & Tips
-
Total compensation is calculated as Base + Additional
-
Input additional compensation by navigating to AKPI Tools > Data Upload > Agency Compensation
⚖️ Reconciliation Notes
-
Invoiced Premium will differ from all Carrier sourced pages: Carrier Production, Profit Share Summary, and Carrier Pulse.
-
Additional compensation can be recorded differently (when received vs. when earned), it’s best to view this data on its own rather than trying to compare it directly with other pages.

📊 Data Sources
-
Agency provided Production reports
💲 Premium Type
-
Invoiced Premium (AMS)
🕒 Time Frame Display
- User-managed timeframe: You can choose the period using the Time Frame Selector.
- Flexible display: Because you control the timeframe, you also control how many months are displayed — anywhere from a single month to multiple years.
- The time frame is based on the invoiced date in the sourced report
🎯 Use Case
-
Assist sales leaders and agency managers in evaluating agency performance and compensation trends to identify production gaps and commission opportunities
-
Track internal production growth over time to measure success and highlight areas needing attention
-
Compare agencies across a broader group or network to uncover benchmarks, outliers, and opportunities for collaboration
💡 Notes & Tips
-
Supports both agency and partner views
-
Useful for incentive programs
⚖️ Reconciliation Notes
-
AMS-entered invoiced premium may lag behind carrier data, and since these come from two different sources, they will never align as a direct match.
📊 Data Sources
-
Agency provided Book of Business reports
-
Agency provided Production reports
-
Includes summed invoiced transactions for all active policies
💲 Premium Type
-
Invoiced Premium (AMS)
🕒 Time Frame Display
- Reflects all invoice dates on active policies
🎯 Use Case
-
Move non-core business to core carriers to strengthen relationships and improve profitability
-
Analyze performance at the producer or account manager level to identify coaching and growth opportunities
-
Align carrier appetite with agency book to maximize placement efficiency and profitability
-
Support M&A and wholesale consolidation analysis by benchmarking premium, commission, and carrier concentration trends
💡 Notes & Tips
-
Use both visual and tabular filtering to explore data
-
Apply pie and bar charts as interactive filters
-
Drill into carriers and policies for deeper insight
-
Broker view includes Account and Account Manager filters
-
Review trendlines to analyze growth over time
-
Often paired with ROI discussions to highlight financial impact
⚖️ Reconciliation Notes
-
Includes AMS data for active policies only and is based on summed invoiced transactions
-
Displays 12 months of data, but for multi-year policies, it includes all invoices tied to the policy. This means a 3-year term policy may show invoices from outside the 12-month window, which can create differences when reconciling against production reports.
📊 Data Sources
-
Agency provided Book of Business reports
-
Agency provided Production reports
-
Includes summed 12MM transactions for all active or expired policies for active accounts
-
Limited Carrier Production from carriers meeting the AKPI standard reporting requirements. On this page, the only metrics derived from carrier reporting are Loss Ratio YTD, New to Book % Current Month, and New to Book % 3 Month Change.
💲 Premium Type
-
Invoiced Premium (AMS)
🕒 Time Frame Display
- Reflects the most recent 12-month period (12MM)
🎯 Use Case
-
Highlight open-market opportunities
-
Support placement strategies for underserved risks
💡 Notes & Tips
-
For commercial or personal lines
-
Three collaboration views: Agency, Partner, Carrier
-
Includes New-to-Book percentage trends for deeper insight into growth
-
Filterable by NAICS (Commercial only), line of business, and Core/Non-Core
⚖️ Reconciliation Notes
-
Includes AMS data for active and expired policies for active accounts only and is based on summed invoiced transactions.
-
Displays most recent 12 months of invoiced data based on agency's last load.
AMS Reports
The Book of Business serves as the source of active accounts and policies but does not contain premium values. Invoiced premium and invoiced date information is instead obtained from Production Reports, which are organized by invoice period. For this reason, both reports are required to provide a complete and accurate view of policy and premium data.
Carrier Production Reports
Carrier Production Reports provide premium and production values sourced directly from carriers, either through carrier portals or carrier-reported files. These reports reflect the carrier’s view of production and may differ from AMS data due to differences in timing, reporting standards, and data availability.

