
Market Assistance: Empowering Networks and Brokers to Drive Strategic Growth
Market Assistance is a data-driven command center for Networks and Brokers using Harmony. It equips you with the visibility, control, and actionable insights needed to empower your agency members, align with carrier partners, and drive performance across your network.
While Market Assistance is accessible at every level—from the Network seat in Harmony to the agency desktop in Understanding—this article focuses on the tools and strategies available to Networks and Brokers.
Don’t see Market Assistance in your sidebar or want to get access? Contact [email protected] to learn more or to subscribe.
Using Market Assistance: Unlocking Reporting Power in Commercial and Personal Lines
Market Assistance offers a powerful suite of filters and charts that allow Networks and Brokers to interactively analyze and guide their book of business across agencies. Whether you're analyzing Commercial Lines or Personal Lines, Market Assistance provides a comprehensive, strategic view of performance.
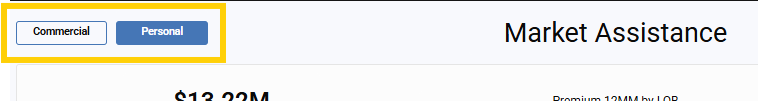
Quick Line Filtering: Commercial vs. Personal
-
Commercial Lines: Full filter set, including NAICS codes (essential for carrier appetite alignment).
-
Personal Lines: NAICS code filtering is not available; all other filters and charts still apply.
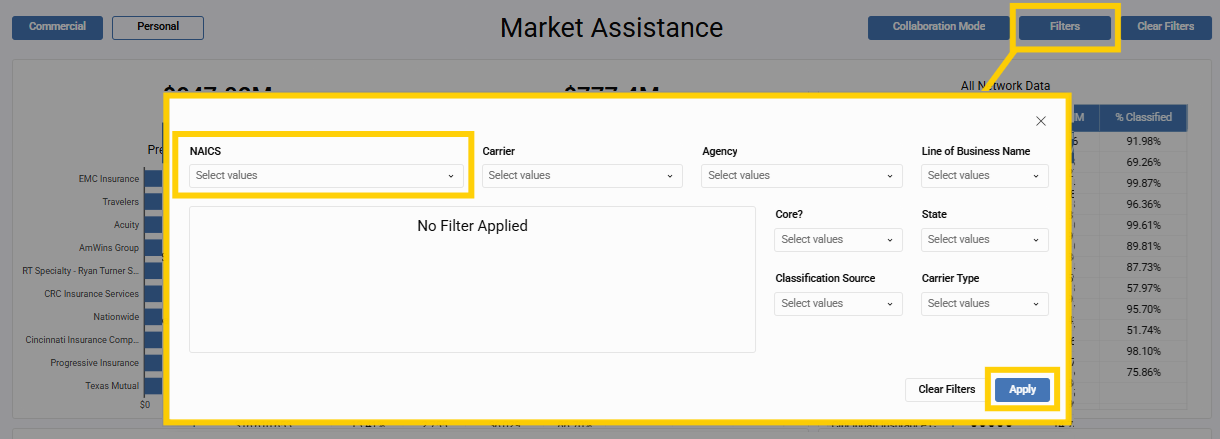
Page-Level Filters (Click “Apply” to Activate)
Commercial Lines filters include:
-
NAICS Code(s) (Commercial only)
-
Carrier
-
Agency
-
Line of Business Name
-
Core?
-
State
-
Classification Source (AMS, Data Axle, Manual)
-
Carrier Type
In Personal Lines, the same options exist except for NAICS Codes.
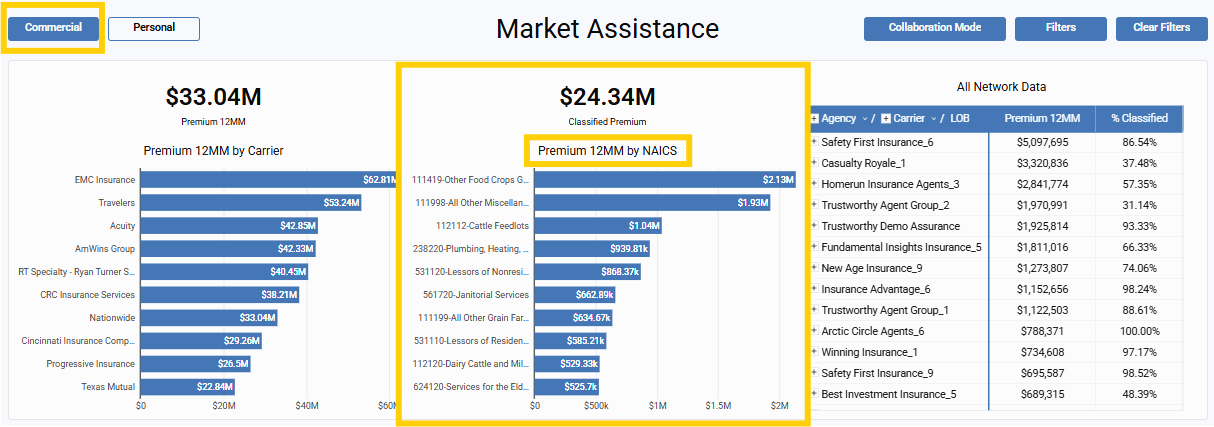
Top-of-Page Visuals: High-Level Insights with Click-to-Filter
At the top of the Market Assistance dashboard, you'll find three key visuals that provide immediate, actionable insights. All three support advanced click-to-filter capabilities, dynamically updating the rest of the dashboard based on your selection.
Premium (12-Month Moving) by Carrier
-
Bar chart showing the top 10 carriers based on 12-month premium.
-
Click any bar to filter the entire page to that carrier.
-
Click another bar to change the filter, or click “Clear filters” to reset.
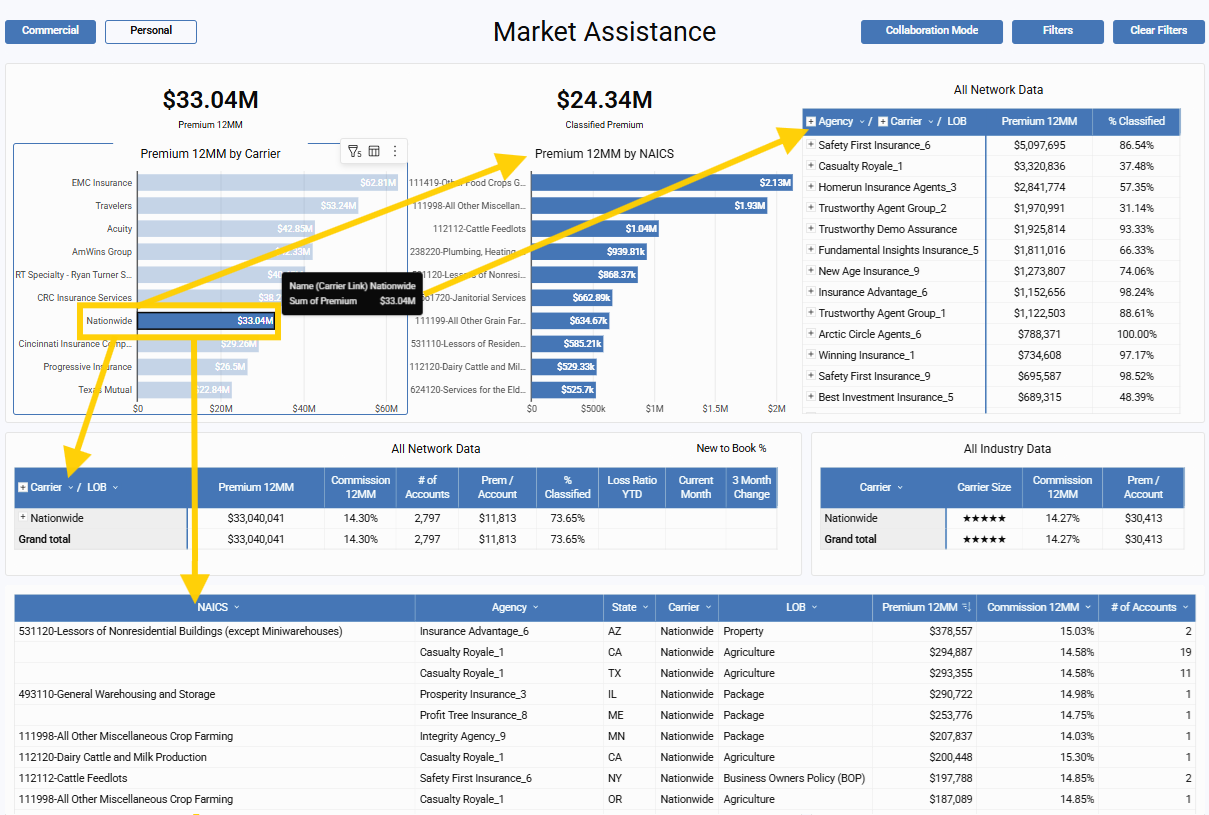
Premium (12-Month Moving)
-
In Commercial Lines: Displays top 10 NAICS codes by premium.
-
Great for evaluating how business classification aligns with carrier appetite.
-
Click a NAICS bar to filter the dashboard to that classification.
-
-
In Personal Lines: Displays top 10 Lines of Business by premium.
-
Useful for seeing which product types (e.g., Homeowners, Auto) are generating the most volume.
-
Click a bar to filter the entire dashboard to that LOB.
-
In both views, filters can be cleared by clicking another bar or selecting “Clear filters.”
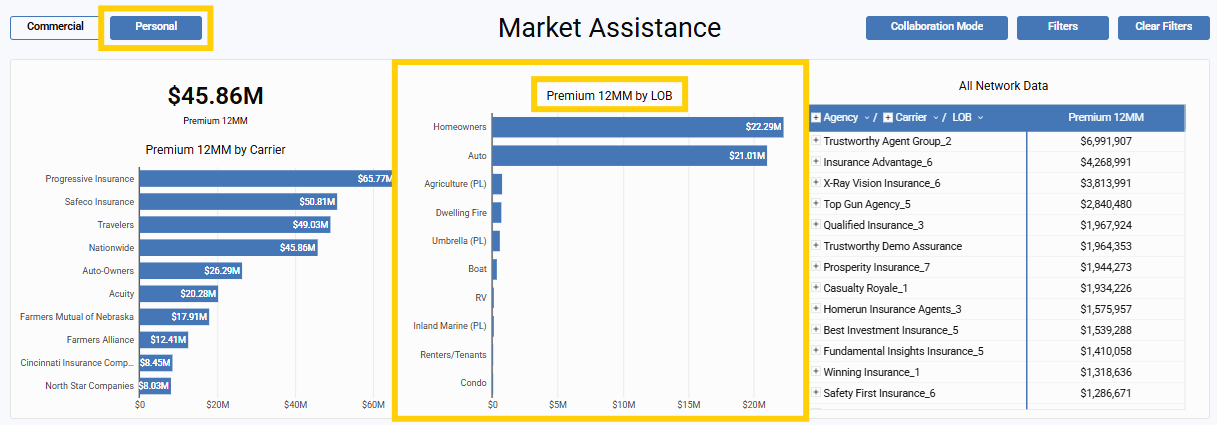
All Network Data (Summary Table)
-
Presents a hierarchical view: Agency > Carrier > Line of Business
-
Columns include:
-
Premium (12MM)
-
% Classified (available only in Commercial Lines)
-
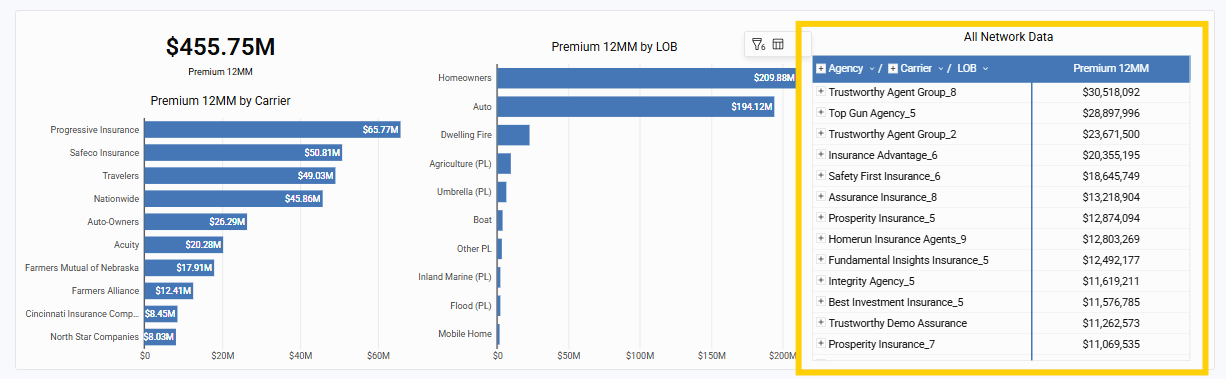
Interactive Tip: Click any agency name to filter the full page to that agency's data. All middle and bottom charts will update accordingly, click another agency name or “Clear filters” to reset.
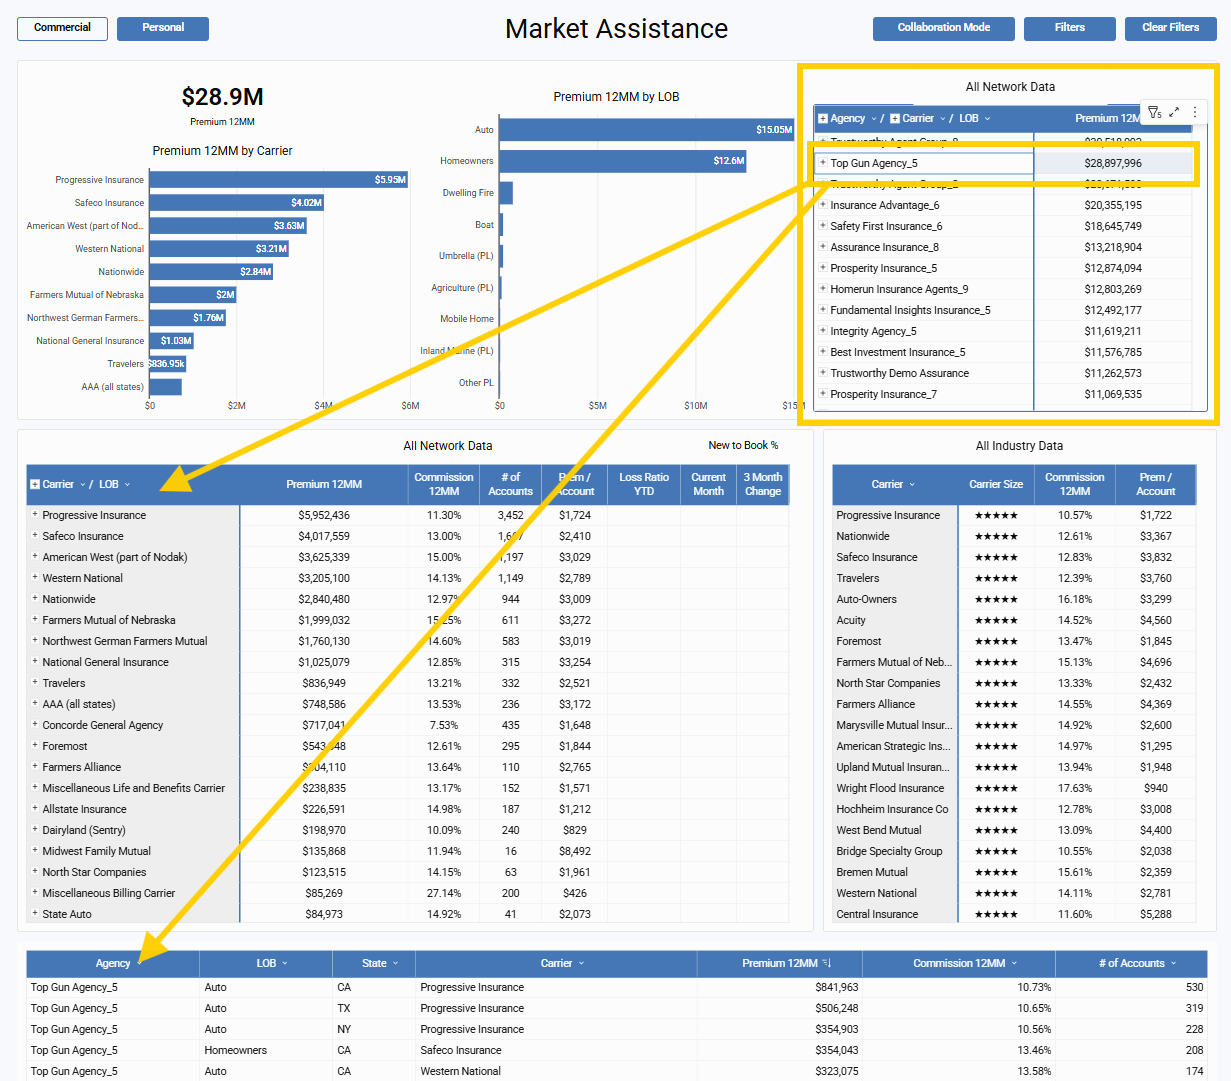
Middle-of-Page Details: Drill into Agency and Carrier Performance
All Network Data (Expanded Table)
This view reflects the network-wide dataset or the selected agency and includes:
-
Carrier
-
Line of Business
-
Premium (12MM)
-
Commission (12MM)
-
Number of Accounts
-
Premium per Account
-
% Classified (NAICS – Commercial Lines only)
-
Loss Ratio YTD
-
New to Book % (Current Month and 3-Month Change)
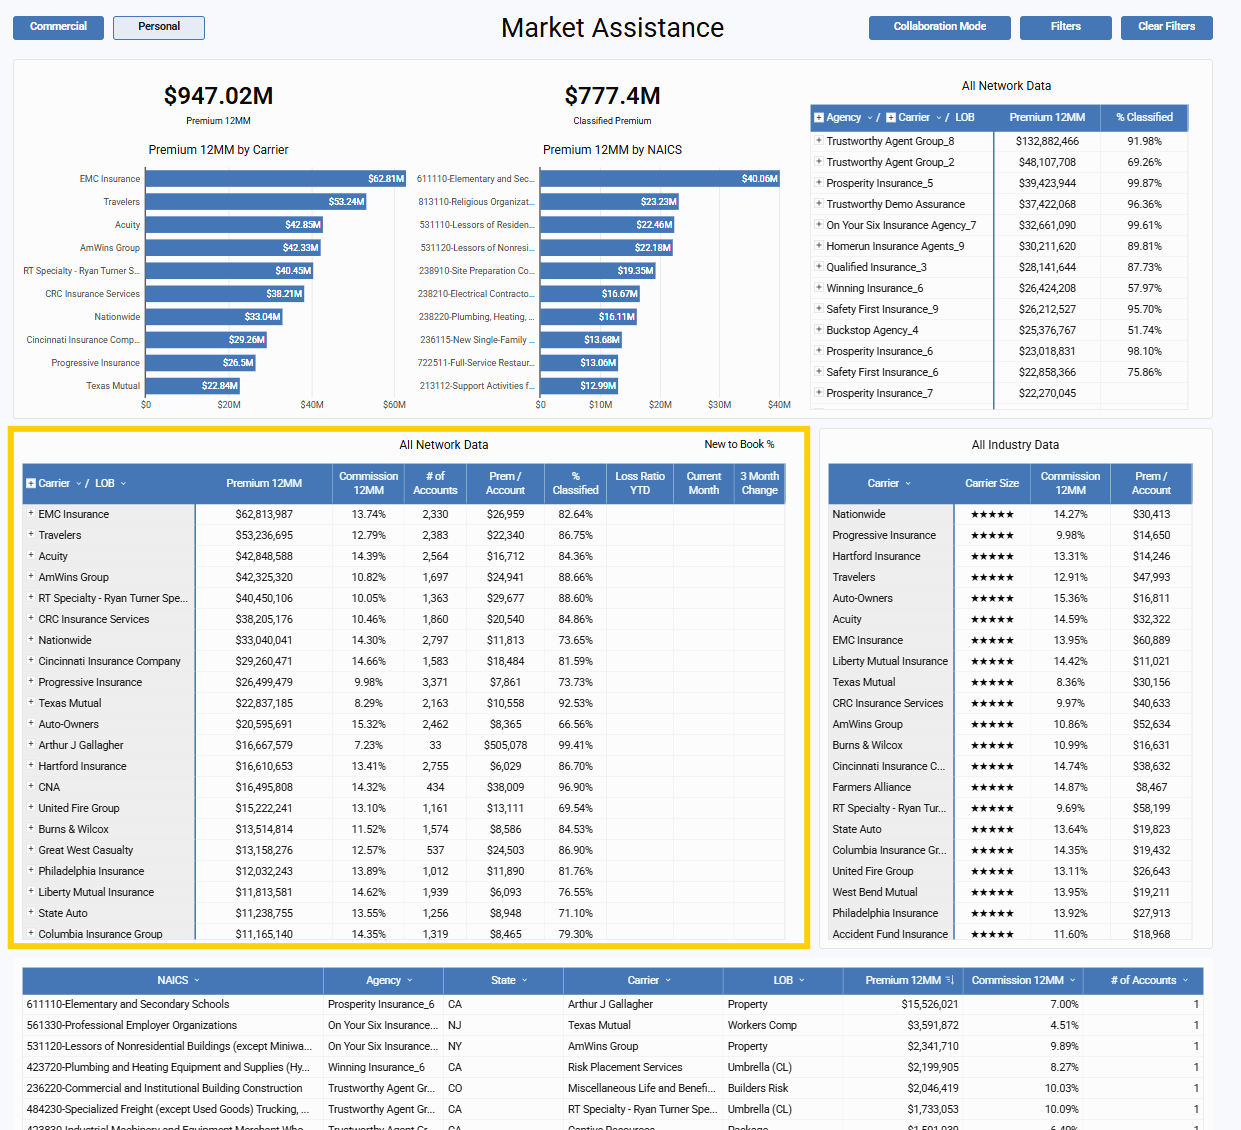
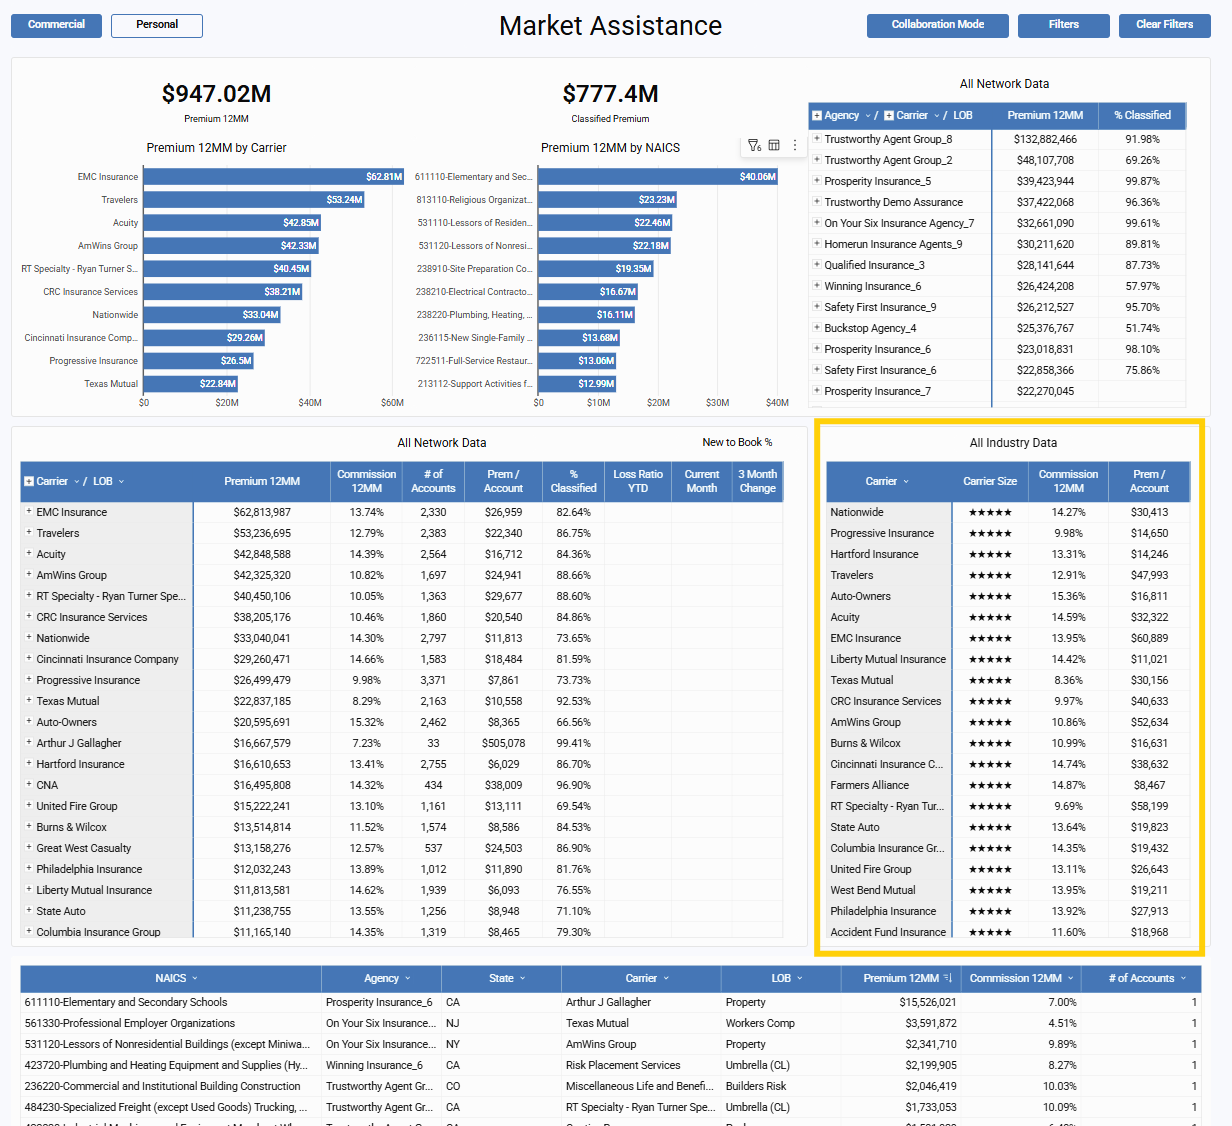
All Industry Data Table
-
Carrier
-
Carrier Size (1 to 5 stars)
-
Commission Rate (12MM %)
-
Premium per Account
Great for comparing network data with broader industry trends.
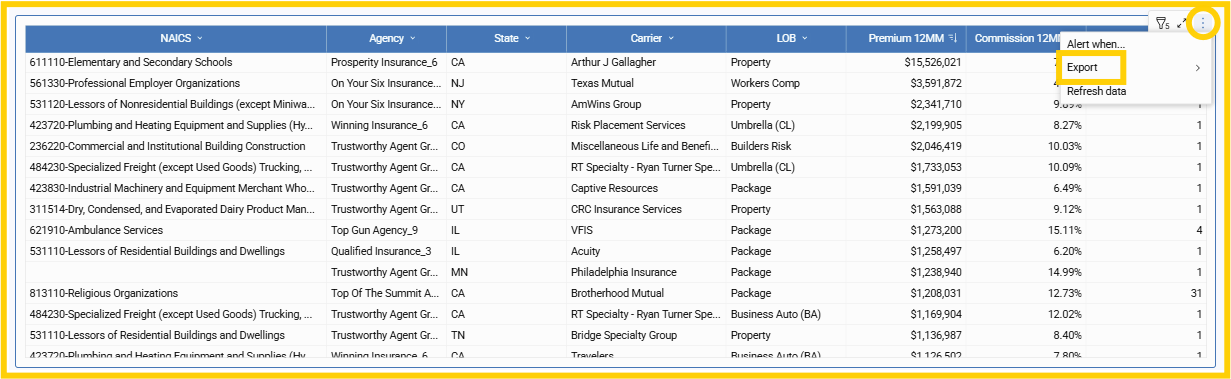
Bottom-of-Page Granularity: Transaction-Level Detail
The most detailed layer of Market Assistance provides line-item level visibility:
-
NAICS (Commercial Lines only)
-
Agency
-
State
-
Carrier
-
Line of Business
-
Premium (12MM)
-
Commission (12MM)
-
Number of Accounts
This data is ideal for export and deep-dive reporting.
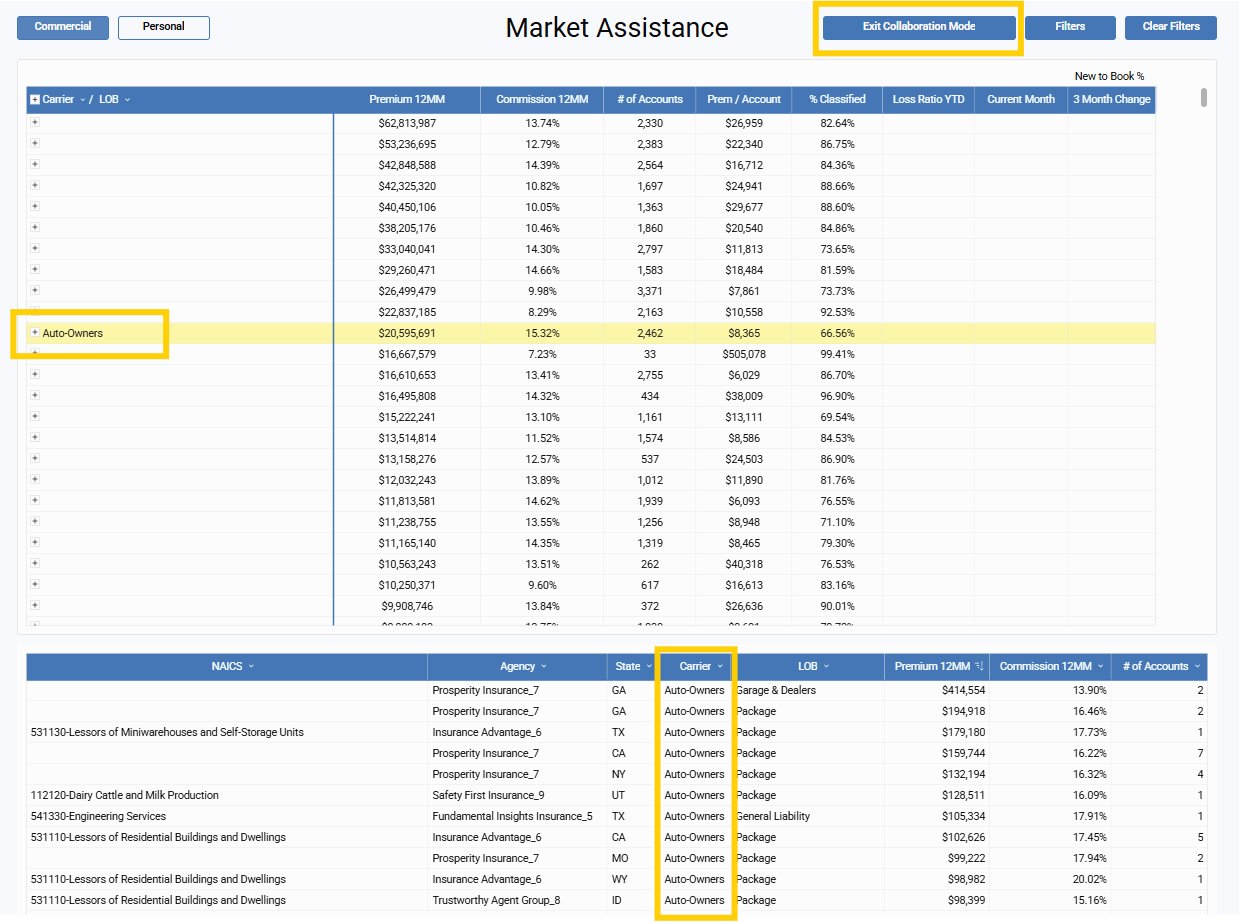
Carrier Collaboration Mode
Used to isolate and focus on a single carrier's performance while masking others.
Steps:
1. Click Carrier Collaboration Mode
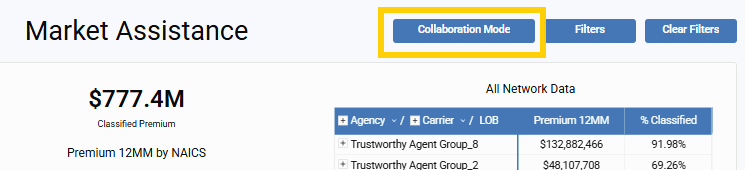
2. Search and select a carrier
3. Click Apply
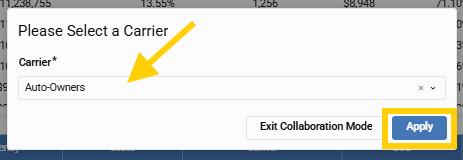
4. Entire dashboard now shows only selected carrier's data; others are masked
5. Click Exit Collaboration Mode to return to full view
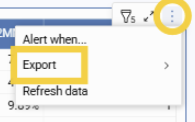
Exporting
-
Click the three-dot menu on any table to export it
Data Refresh & Source
-
Data is refreshed nightly
-
Files uploaded before 10 PM CST are viewable by the next day
-
-
Sourced from:
-
Book of Business Reports → Customer accounts
-
Production Reports → Premium & Commission (12MM)
-
Carrier Reports → Loss Ratios (if fields are available)
-
Use Cases for Networks & Brokers
Here are practical, outcome-driven ways to use Market Assistance effectively:
1. Strengthen Carrier Alignment
Goal: Understand what classes of business are written and how well they align with your core carriers.
-
Filter by NAICS (Commercial Lines) to see how business classes match carrier appetite
-
Use Premium by NAICS to identify underserved or high-potential segments
-
Share results directly with carrier partners during QBRs or renewal meetings
2. Agency Coaching and Support
Goal: Help struggling agencies improve their production mix or diversify carrier relationships.
-
Click into an individual agency via the All Network Data table
-
View which carriers are being underutilized or over-concentrated
-
Use insights to recommend strategic carrier shifts or training opportunities
3. Market Penetration Tracking
Goal: Measure and report how well your network is penetrating key industries or product lines.
-
Use Premium by LOB (Personal) or Premium by NAICS (Commercial) to see top verticals
-
Analyze year-over-year growth using filters + exportable data
-
Build a heat map or summary report for leadership
4. Carrier Negotiations
Goal: Use concrete data to support carrier negotiations or bonus tier conversations.
-
Activate Carrier Collaboration Mode
-
Present clean, focused data for the carrier across all affiliated agencies
-
Export supporting tables to present hard numbers in carrier meetings
5. Monitor New-to-Book Trends
Goal: Spot growth opportunities or drop-offs in new business.
-
Use the Expanded All Network Data Table
-
Monitor New-to-Book % (Current + 3-Month Change) to detect trends
-
Follow up with agencies showing unexpected changes
The Strategic Power of Market Assistance
Market Assistance helps Networks and Brokers turn big-picture performance into targeted action. From strategic filtering to agency-level benchmarking and carrier alignment, it’s your growth dashboard—designed for insight, built for impact.

