
Revenue Tuner for Understanding
Revenue Tuner is more than a report—it’s your strategic command center for maximizing premium, optimizing carrier relationships, and managing production across your agency. Designed for data-driven agencies, this tool transforms the way you monitor, evaluate, and plan for growth.
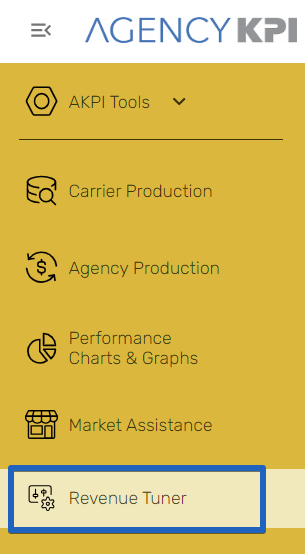
Access to Revenue Tuner
Revenue Tuner is available within your Understanding platform.
Note: Access requires a subscription upgrade. If you’d like to learn more or believe you should already have access, contact us at [email protected].
Data Source & Scope
The insights shown in Revenue Tuner are powered by your monthly AMS data upload. Specifically:
-
The Book of Business report supplies active customers and policies.
-
The Production Report contributes billed premium and commission amounts from the last 12 months.
This pairing ensures Revenue Tuner reflects current production values while maintaining a clear, actionable snapshot of your active book.
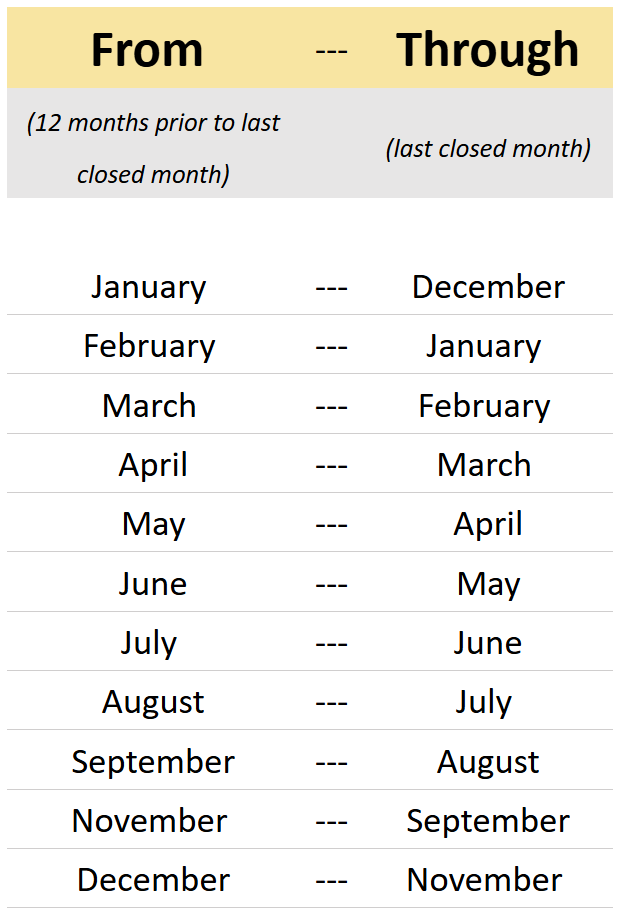
Report Dates: Set It Right, See It Right
To ensure Revenue Tuner calculates premium and commissions correctly:
-
Upload a rolling 12 months of data with each update.
-
Use “From” and “Through” dates that reflect your intended reporting period.
-
Use Policy Detail Table filters to tailor your upload view as needed.
Navigate Like a Pro
Revenue Tuner gives you flexible controls to slice and dice your book of business however you need.
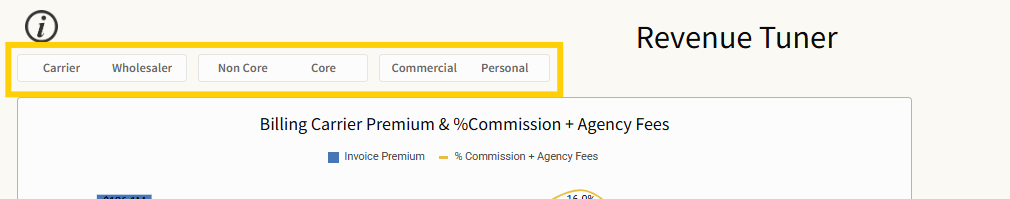
Top Quick Filters
Located at the top of the page, these high-level toggles let you filter the entire report view:
-
Carrier or Wholesaler
-
Non-Core or Core
-
Commercial or Personal
Choose one option per category to instantly reshape the report across all views.
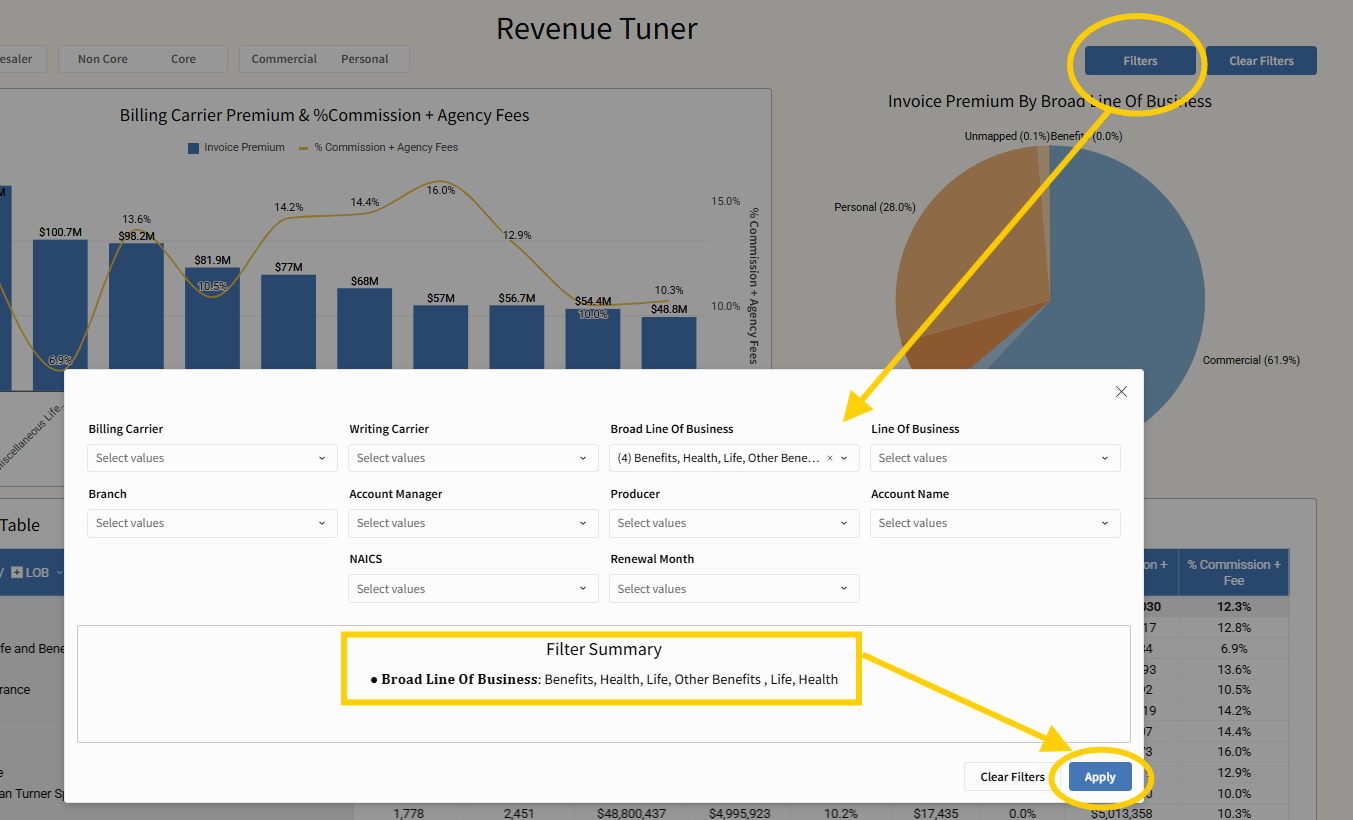
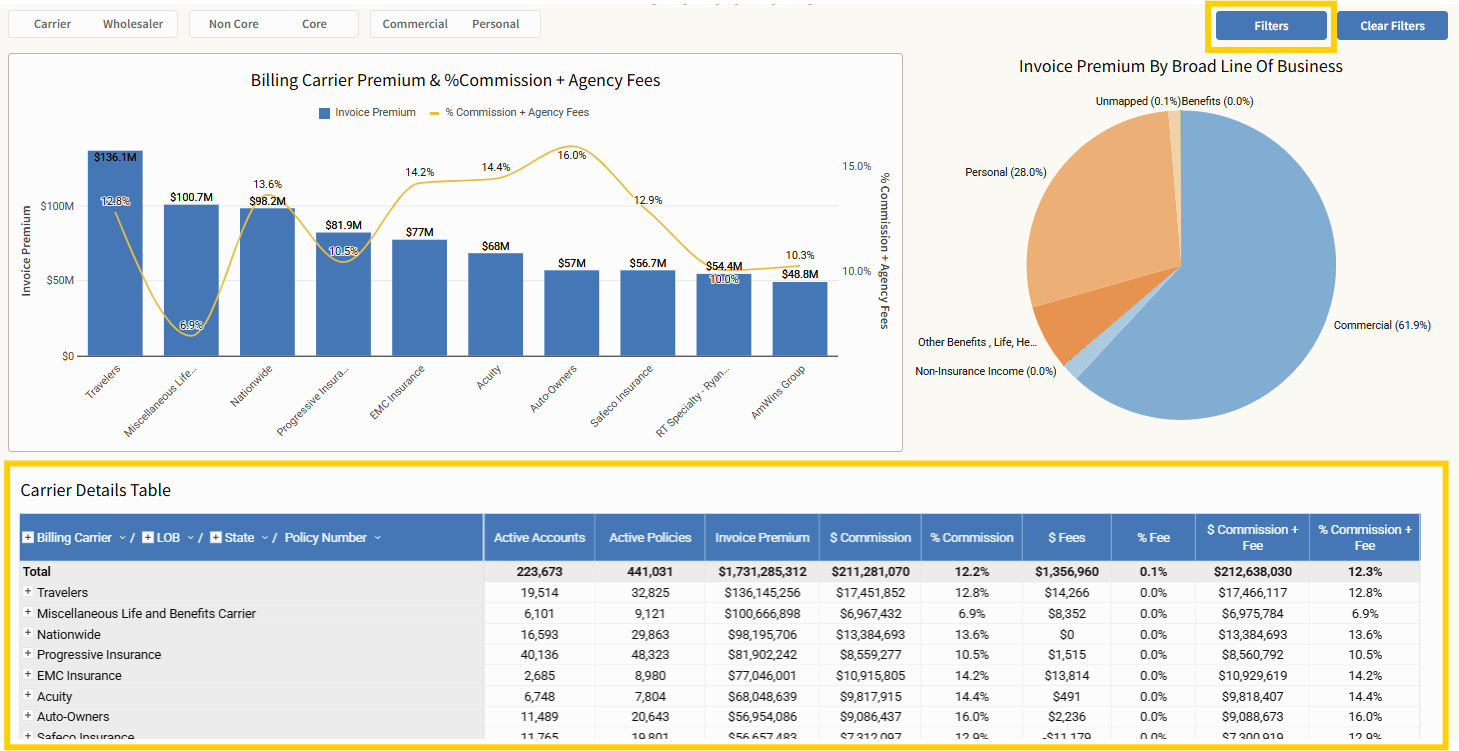
Additional Filters for Deeper Insight
For even more precision, open the filter drawer. These filters apply across the entire report, including both the Carrier Details Table and Policy Details Table.
You can filter by:
-
Billing Carrier
-
Writing Carrier
-
Broad Line of Business
-
Line of Business
-
Branch
-
Account Manager
-
Producer
-
Account Name
-
NAICS Code
-
Renewal Month
These support multi-select. Combine them freely for advanced segmentation. Use “Clear Filters” to reset your view at any time.
Interactive Visual Filtering
The report is highly interactive and responds to your clicks.
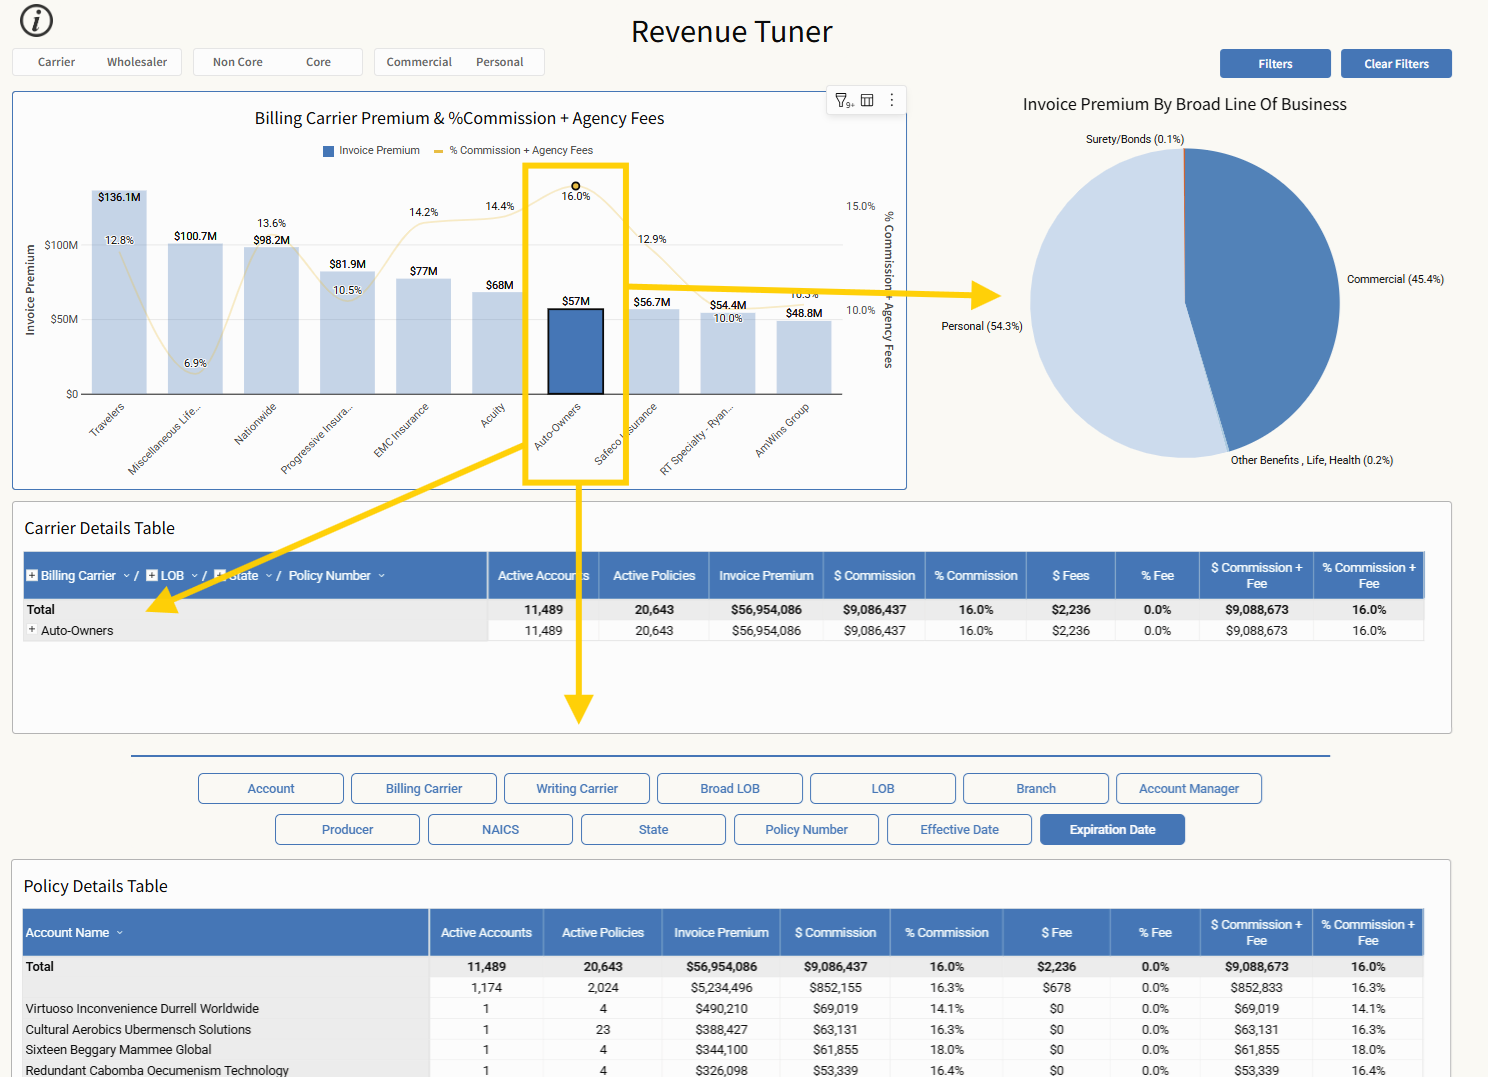
Bar Graph Filtering
At the top, the “Billing Carrier Premium & % Commission + Agency Fees” bar chart acts as a live filter:
-
Click any bar to filter the report by that carrier
-
Your selection will cascade through all tables below
-
To clear your selection, either click a different bar or choose “Clear Filters”
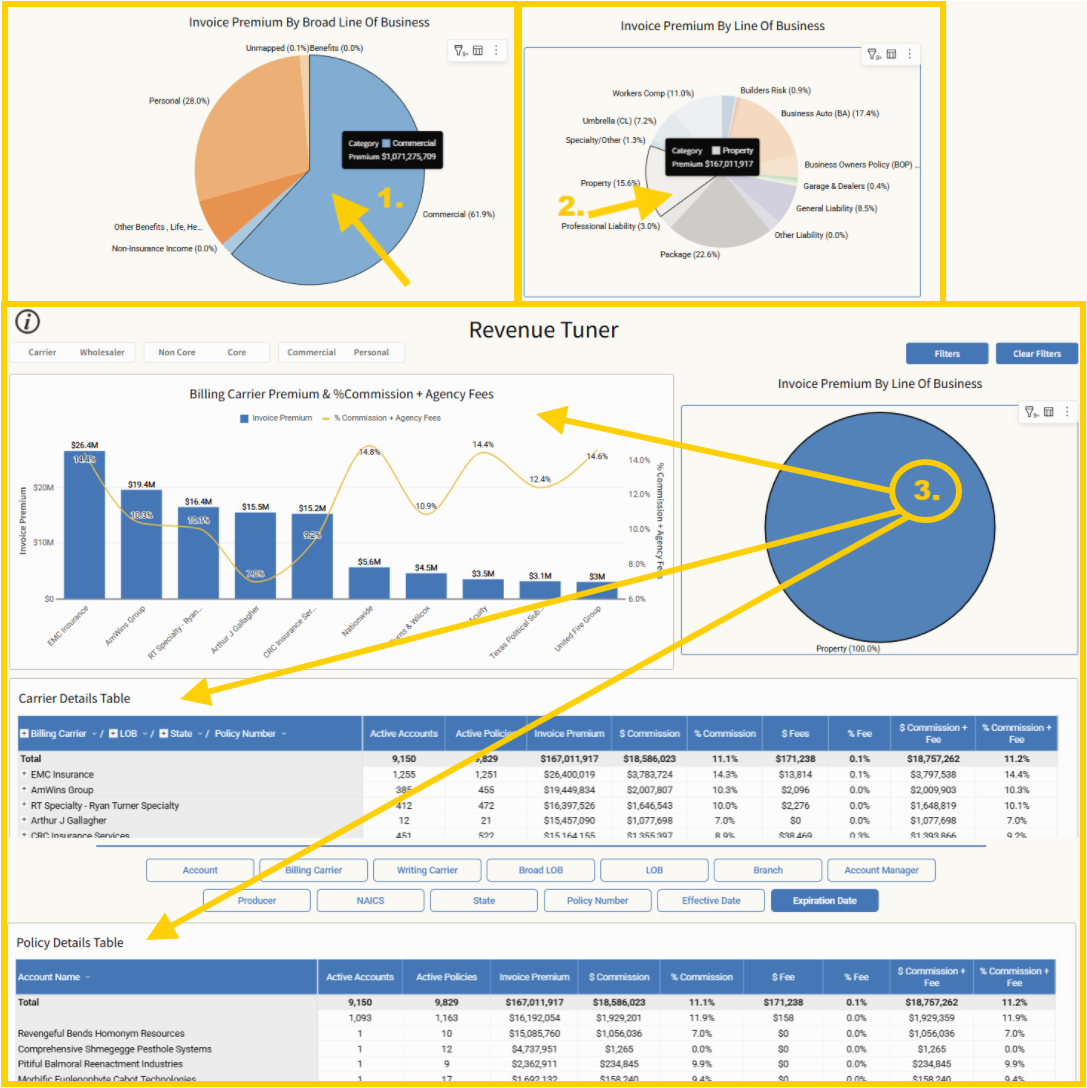
Pie Chart Navigation
Use the pie chart to drill down visually through your book. Each click acts as a filter and updates the rest of the report:
-
Invoice Premium by Broad Line of Business
-
Line of Business
To clear your selection, choose “Clear Filters”
Carrier Details Table: Your High-Level Revenue Snapshot
The Carrier Details Table gives you a strategic overview of production across carriers.
By default, the main column is grouped as:
-
Billing Carrier > Line of Business > State > Policy Number
Additional columns displayed:
-
Active Accounts
-
Active Policies
-
Invoice Premium
-
$ Commission
-
% Commission
-
$ Fees
-
% Fee
-
$ Commission + Fee
-
% Commission + Fee
Use this table to evaluate carrier performance, compare profitability, and identify opportunities before drilling into policy-level details below.
Use the filter in the upper right corner of the page to filter further.
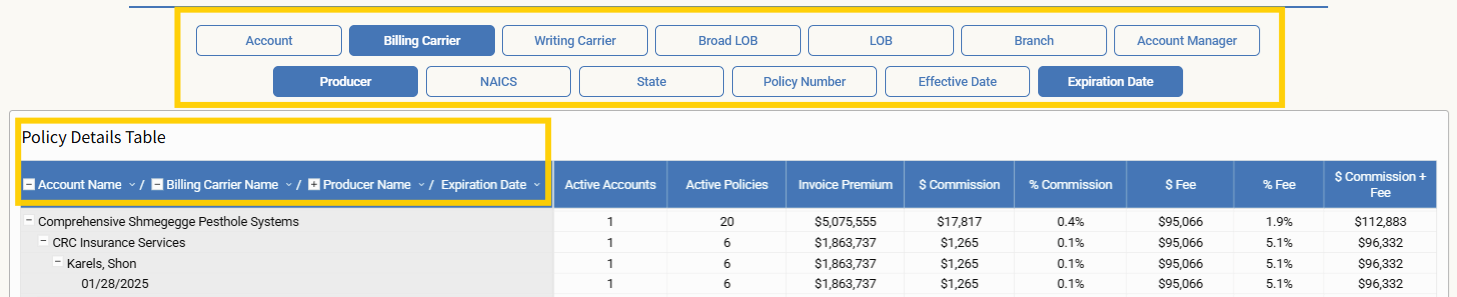
Policy Details Table: Drill Down with Precision
At the bottom of the Revenue Tuner page, the Policy Details Table gives you line-item-level insight into your agency’s data.
Advanced Table Filters
Directly above the table, these filters apply only to the Policy Details Table. Use them to pinpoint policies with precision:
-
Account
-
Billing Carrier
-
Writing Carrier
-
Broad Line of Business
-
Line of Business
-
Branch
-
Account Manager
-
Producer
-
NAICS
-
State
-
Policy Number
-
Effective Date
-
Expiration Date
You can multi-select in any filter. Filters are applied in the order selected, which sets the drill-down hierarchy. Use “Clear Filters” to reset this view.
Use Cases: Turn Insight into Action
Move Non-Core to Core*
-
Filter: Non-Core
-
Analyze: Carrier Details Table
-
Click a carrier > View Policy Details
-
Add filters: Account Manager, Expiration Date, Renewal Month
Spot policies ready for conversion to preferred core carriers.
Analyze by Producer or Account Manager*
-
Filter: Commercial or Personal
-
In Policy Details Table, select a Producer or Account Manager
-
View filtered results in Carrier Details Table
-
Add: Effective Date, Expiration Date, Renewal Month
Use this view for renewal planning and team strategy meetings.
Align with Carrier Appetite*
-
Filter: Commercial
-
Add NAICS codes in filter drawer
-
View aligned carriers in Carrier Details Table
-
Click a Carrier > Filter Policy Details
-
Add Renewal Month to time your opportunities
Match policies to carrier appetites to negotiate better placements and commission.
Mergers & Acquisitions*
-
Upload data from acquired agency (supported AMS required)
-
Use filters to combine and compare books
-
Identify standardization opportunities by Expiration Date
Bridge the knowledge gap and start optimizing revenue from day one.
Wholesale Consolidation*
-
Filter: Wholesaler + Commercial
-
Click Writing Carrier in Policy Details
-
Review Billing Carriers, commissions, and fees in Carrier Details
-
Add Renewal Month to focus on upcoming moves
Streamline wholesaler relationships and consolidate for better terms.
*FOR SCREENSHOTS OF THESE FILTERS APPLIED, CLICK HERE
Quick Tips for Power Users
Find Standard Paper in a Wholesaler*
-
Filter: Wholesaler + Commercial
-
Scroll to Policy Details Table
-
Click: Writing Carrier, then Billing Carrier
-
Expand rows, filter by: LOB, Expiration, Account Manager
Consolidate Writing Carriers in a Wholesaler*
-
Filter: Wholesaler + Commercial
-
Click Writing Carrier in Policy Details Table
-
View commission levels in Carrier Details
-
Filter by Renewal Month to narrow your target timeframe
*FOR SCREENSHOTS OF THESE FILTERS APPLIED, CLICK HERE
Downloading Tables
You can download any data table on this page for further analysis, archiving, or presentation.
How to Export:
-
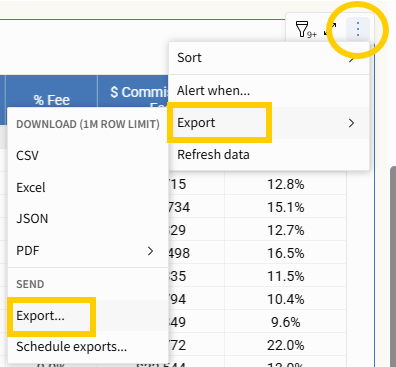
Hover over the table you want to export (either the Details Table or Monthly Details Table).
-
Click the three-dot menu in the upper-right corner of the table.
-
Select Export.
If you’ve formatted or customized the table, additional steps are recommended to preserve your layout and headings.
For Formatted Tables:
-
Click Export again in the send section.
-
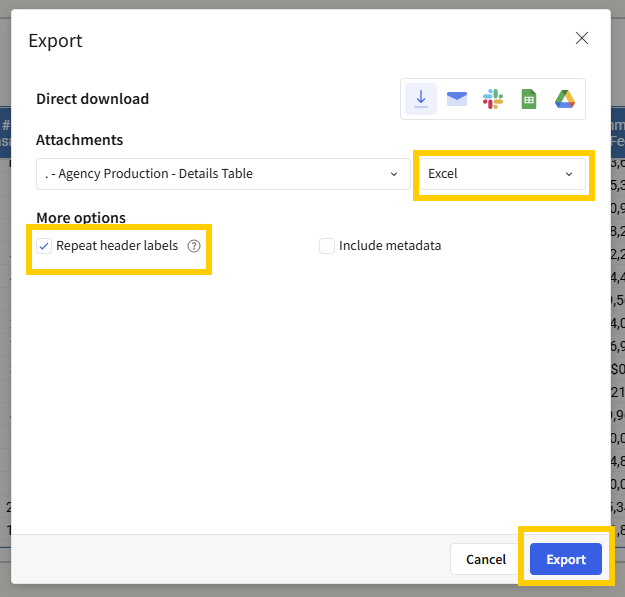
A new window will open. From here:
-
Select Excel as the file format.
-
Choose the option to Repeat Header Labels.
-
-
Click Export once more to finalize and download your file.
This ensures that any filtered or customized view—including selected columns or metrics—is preserved in the exported version.
Bookmarking Your View
To streamline your workflow and avoid repeating filter setups, you can save custom views as bookmarks and return to them anytime.
How to Save a Bookmark
-
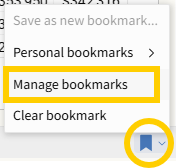
Look for the gray bar at the bottom of the page.
-
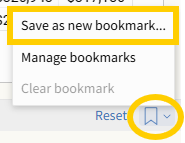
In the right-hand corner, click the ribbon icon.
-
From the options presented, select “Save as new bookmark.”
-
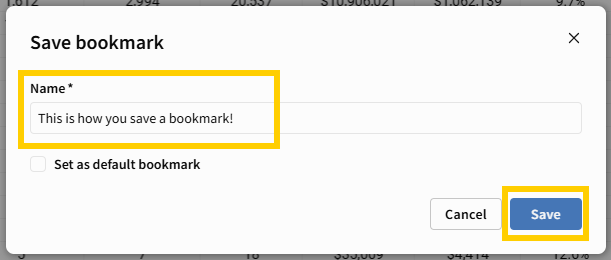
A Save Bookmark modal will appear:
-
Enter a custom name for your bookmark.
-
(Optional) To make this your new default view, check “Set as default bookmark.”
-
-
Click Save.
Your personalized view—including filters, columns, groupings, and time selections—will be stored for future use.
How to Access a Saved Bookmark
If you did not set your bookmark as the default, here’s how to revisit it later:
-
Click the ribbon icon in the bottom-right of the page. It will now be green.

-
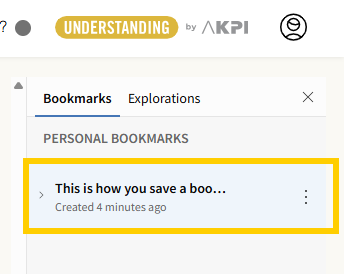
Choose “Manage Bookmarks.”
-
A right-side navigation bar will open showing your saved bookmarks.
-
Select your saved bookmark from the list.
Bookmarks are a powerful way to revisit workflows, replicate reports, or switch between saved perspectives—whether you're analyzing producers, carriers, or time-based trends.
Final Word: From Reporting to Results
Revenue Tuner isn’t just a report—it’s a performance advantage. From producers to partners, from consolidations to renewals, it helps you make informed, timely, and impactful decisions.
Explore it. Apply it. Maximize it.

