
The Due Diligence Report in Harmony offers a high-level evaluation of agency and producer performance, account composition, commission trends, and growth over time. It is designed to provide clarity into how your business is concentrated, and where potential risks or opportunities may exist.
This report consists of six main visualizations, each offering a distinct lens into your book of business. Below is a breakdown of each chart, what it shows, and how users can interact with it.
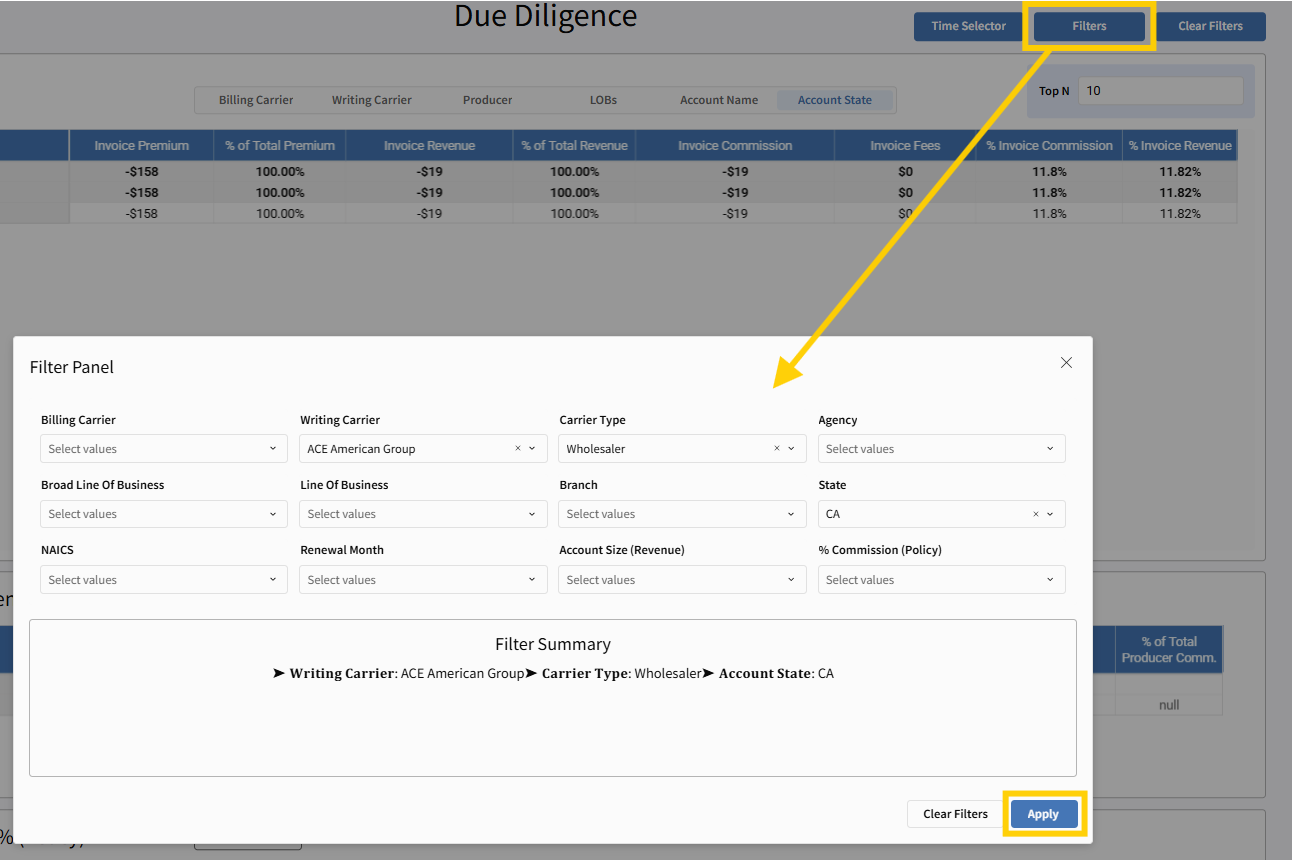
Page-Level Filtering
The Due Diligence Report includes a global multi-select filter that applies to the entire page. This allows users to refine results across all charts simultaneously.
Available Filters:
-
Billing Carrier
-
Writing Carrier
-
Carrier Type
-
Agency
-
Broad Line of Business
-
Line of Business
-
Branch
-
State
-
NAICS
-
Renewal Month
-
Account Size (Revenue)
-
% Commission (Policy)
Important Notes:
-
These filters apply globally to the page, including the Concentration, Account Size, and Base Commission charts.
-
The charts do not filter one another. Selecting a data point in one chart (e.g., top producer) does not dynamically affect the others.
Use Cases for Filtering
This report is highly versatile. Here are several practical use cases for applying the page-level filters:
Agency Performance Deep Dive: Filter by agency to assess producer performance, account size distribution, and average commission rates.
Carrier Strategy Review: Isolate specific carriers to compare revenue contribution, commission structures, and agency engagement.
LOB Analysis: Filter by line of business or branch to explore business mix and revenue concentration.
Renewal Planning: Use renewal month filters to project upcoming revenue and commission opportunities or risks.
Profitability Analysis: Combine account size and commission filters to find high-volume, low-margin segments or vice versa.
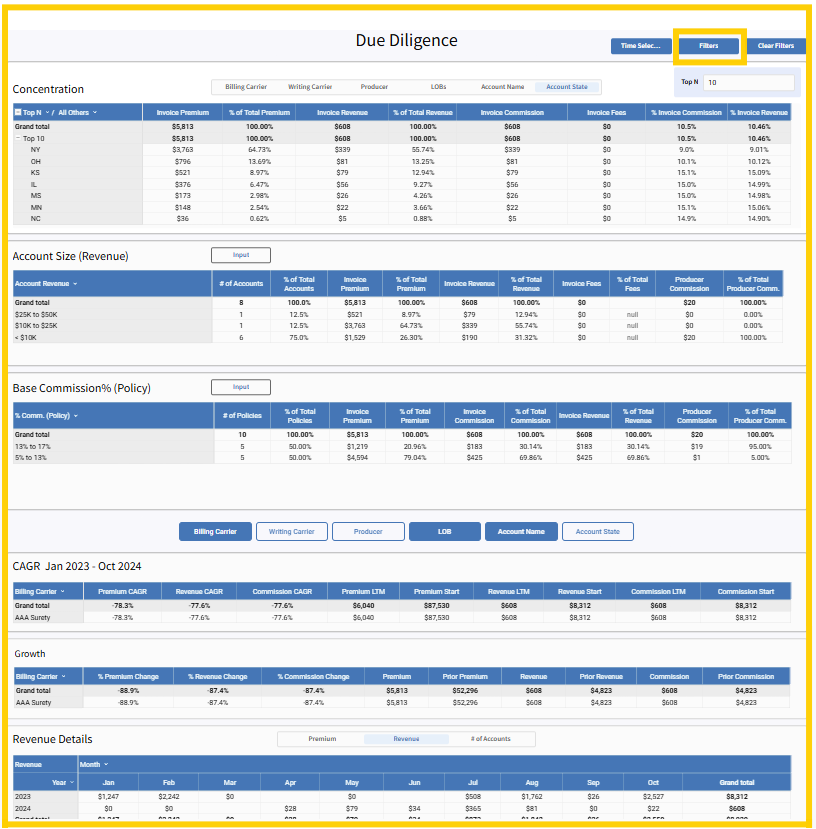
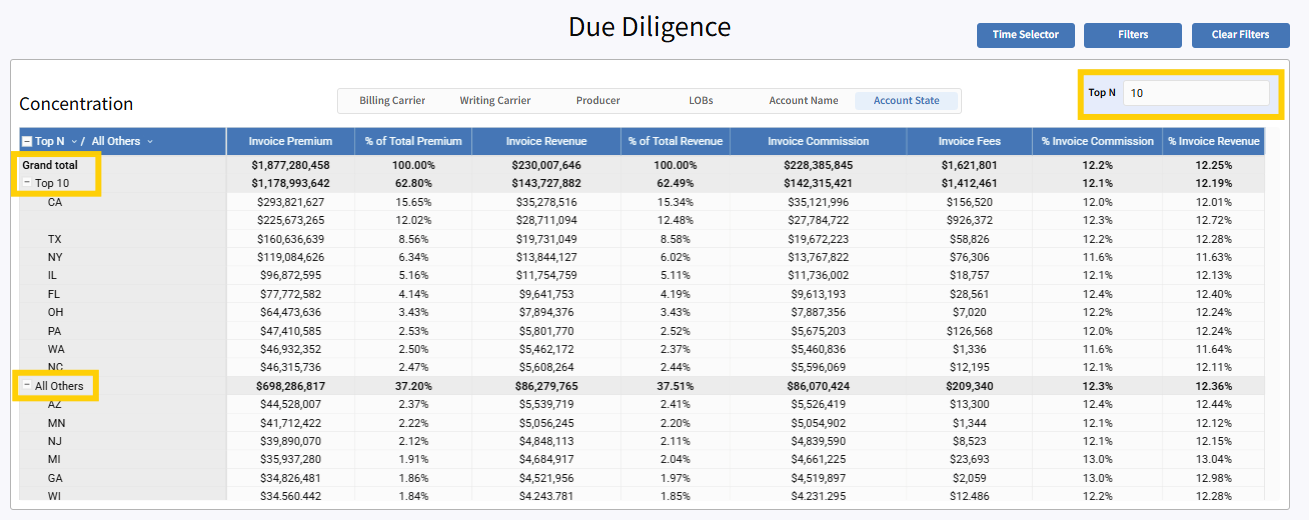
Concentration Chart
The Concentration chart offers a detailed breakdown of revenue and premium distribution across your top entities. By default, this displays the Top 50, but users can adjust this to show a different number of entries, such as the Top 10.
Available Metrics:
Each entity is evaluated by:
-
Invoice Premium
-
% of Total Premium
-
Invoice Revenue
-
% of Total Revenue
-
Invoice Commission
-
Invoice Fees
-
% Invoice Commission
-
% Invoice Revenue
Filtering Options:
You can customize the view by selecting from:
-
Billing Carrier
-
Writing Carrier
-
Producer
-
LOBs
-
Account Name
-
Account State
A "Top N" selector allows you to define how many top-performing entities are shown. The chart will also include an "All Others" category, giving you visibility into concentration risk beyond the top performers.
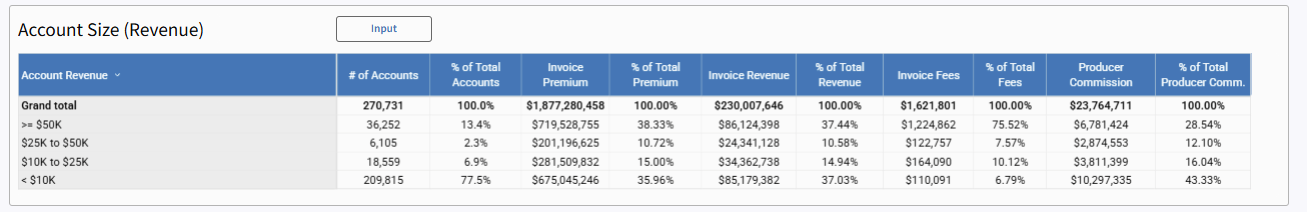
Account Size (Revenue)
This chart segments accounts by revenue size, helping you assess how your book is distributed by scale. It gives a sense of how much of your business is driven by small vs. large accounts.
Available Columns:
-
# of Accounts
-
% of Total Accounts
-
Invoice Premium
-
% of Total Revenue
-
Invoice Fees
-
% of Total Fees
-
Producer Commission
-
% of Total Producer Commission
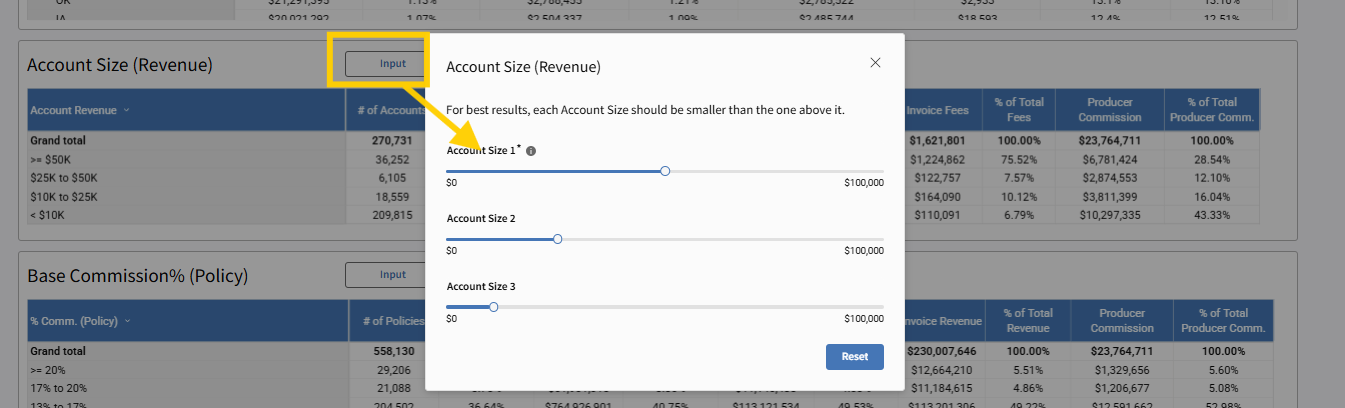
Input Options:
Users can choose between predefined groupings:
-
Account Size 1
-
Account Size 2
-
Account Size 3
Each input changes how accounts are grouped, providing flexibility based on business context. Make your selections, click the x when complete, or choose Reset.
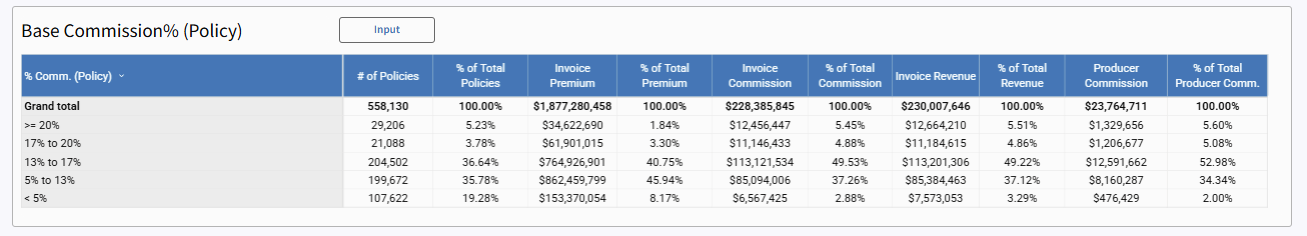
Base Commission % (Policy)
This chart shows the distribution of base commissions earned at the policy level. It is sorted by base commission % at the policy level, offering insights into average earning rates across different segments of your book.
Available Columns:
-
# of Policies
-
% of Total Policies
-
Invoice Premium
-
% of Total Premium
-
Invoice Commission
-
% of Total Commission
-
Invoice Revenue
-
% of Total Revenue
-
Producer Commission
-
% of Total Producer Commission
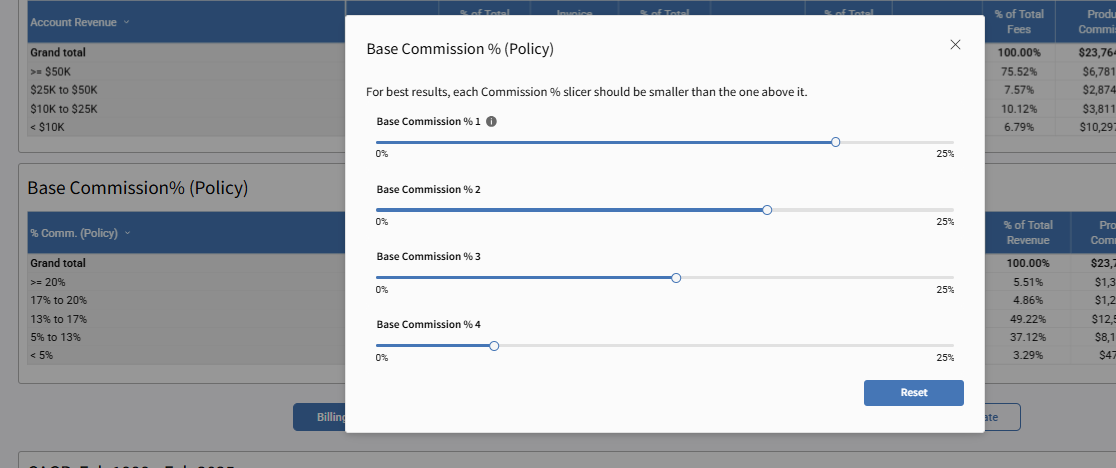
Input Options:
Users can choose from four base commission percentage ranges to sort the chart and highlight different commission tiers. Make your selections, click the x when complete, or choose Reset.
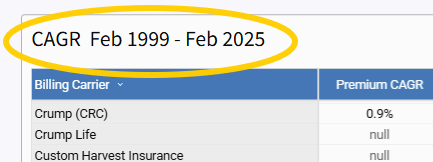
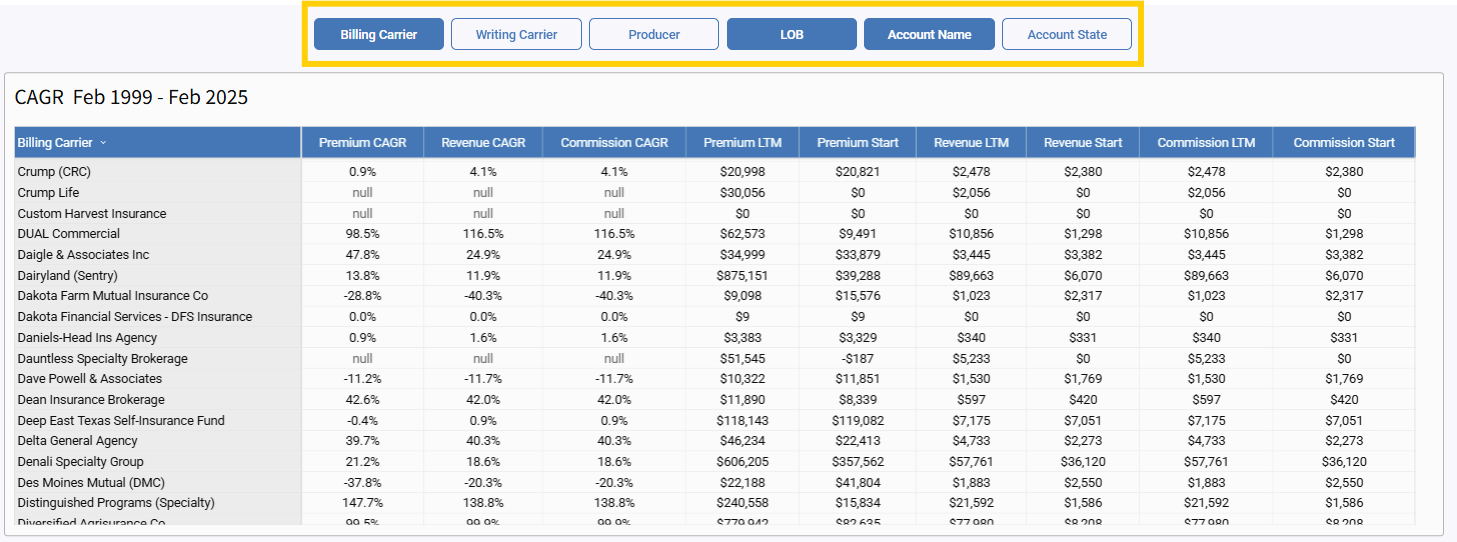
CAGR (Compound Annual Growth Rate)
The CAGR chart measures long-term performance trends by calculating the compound annual growth rate of key financial metrics over a four-year period.
Time Frame:
This chart is static and reflects a default period. It does not change based on custom date range selections elsewhere on the page.
Metrics Displayed:
-
Billing Carrier
-
Premium CAGR
-
Revenue CAGR
-
Commission CAGR
-
Premium Start
-
Premium LTM (Latest Twelve Months)
-
Revenue Start
-
Revenue LTM
-
Commission Start
-
Commission LTM
Filters:
You can apply additional filters specific to this chart:
-
Billing Carrier
-
Writing Carrier
-
Producer
-
Line of Business (LOB)
-
Account Name
-
Account State
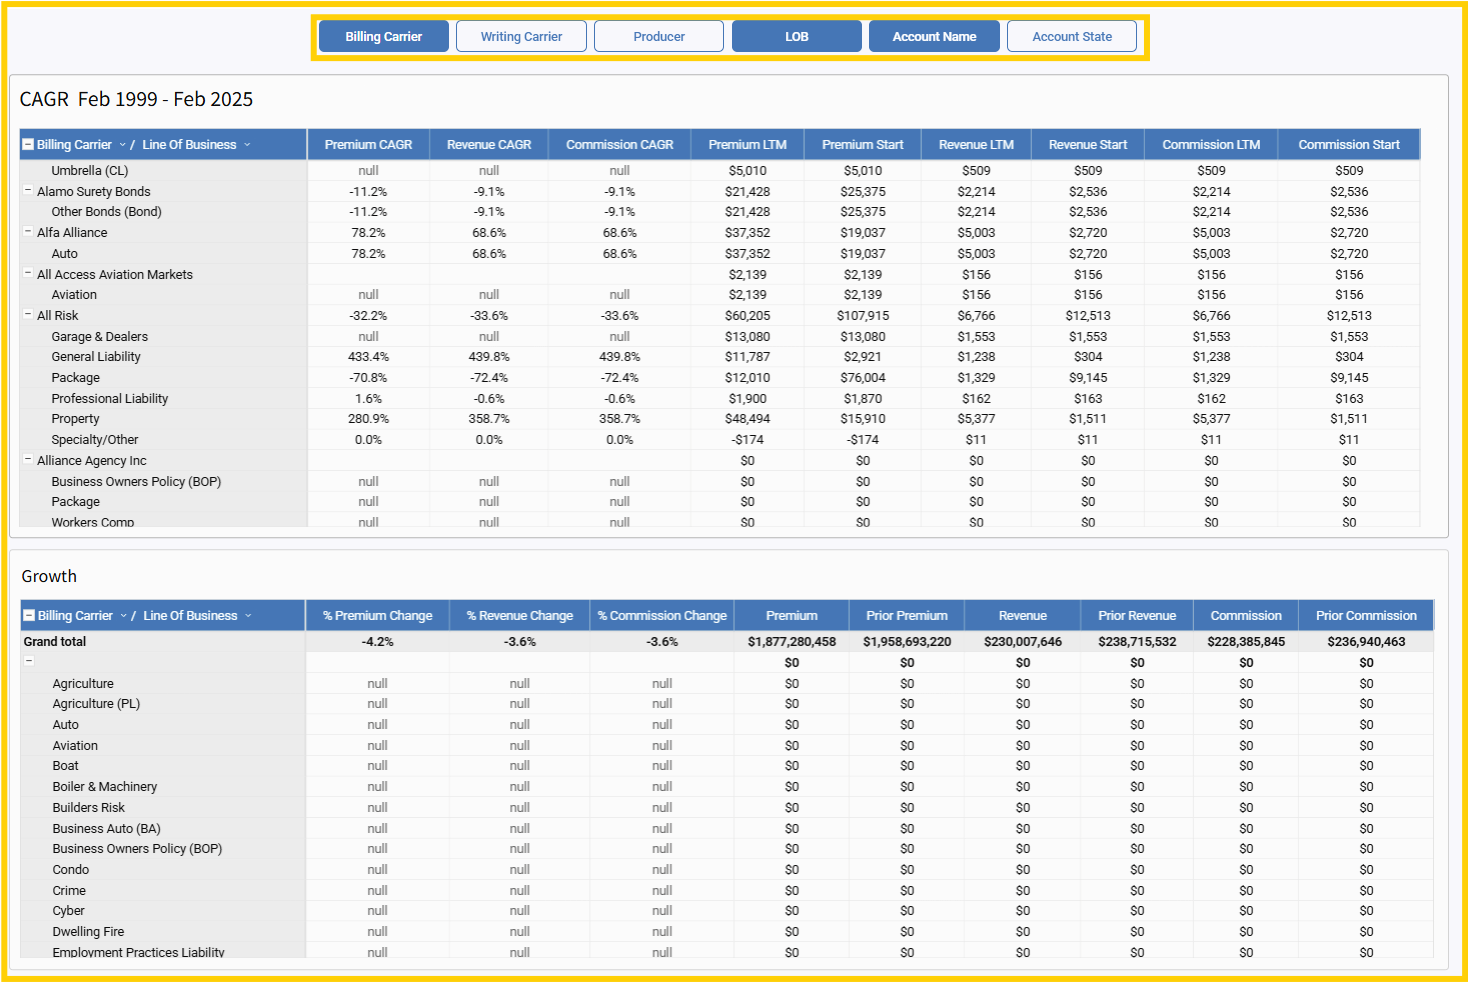
Growth Table
This table sits directly below the CAGR chart and presents start and end values for premium, revenue, and commission. It allows for a side-by-side view of raw growth, rather than percentage-based CAGR.
Shared Filters:
The Growth Table uses the same filtering options as the CAGR chart:
-
Billing Carrier
-
Writing Carrier
-
Producer
-
LOB
-
Account Name
-
Account State
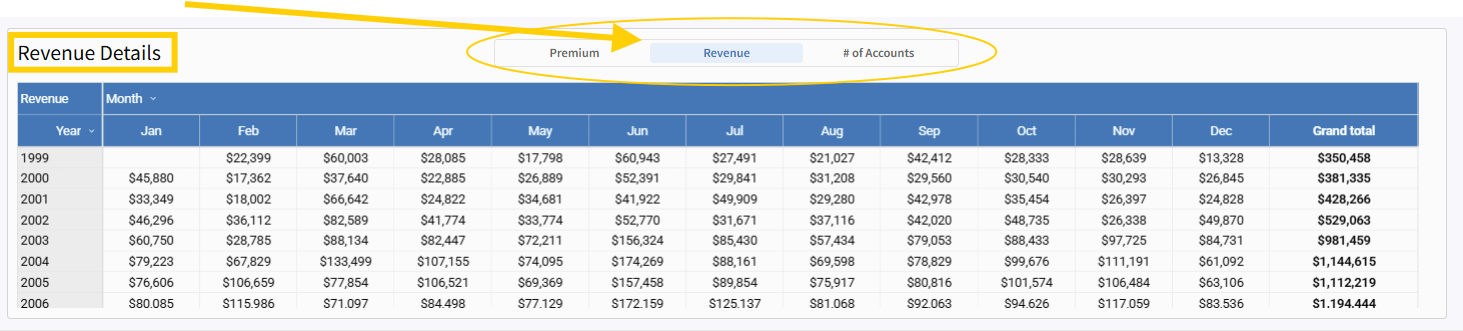
Time Series Summary (Premium, Revenue, or Number of Accounts)
This chart provides a chronological view of business performance, making it ideal for spotting seasonality or long-term trends.
Display Format:
-
Data is organized by Year and then by Month within each year
-
Ends with a Grand Total column
-
Users can toggle between views for:
-
Premium
-
Revenue
-
Number of Accounts
-
Data Range:
Depending on the data set, this chart may reflect many years of historical data.
Use Cases
| Use Case: | What You’ll Uncover: |
| Revenue Concentration Risk | Identify over-reliance on specific agencies, producers, LOBs, or regions. Improve diversification and reduce exposure. |
| Producer Scorecards with Context | See book size, margin, commission levels, and growth trends for individual producers or agencies. Great for coaching and planning. |
| Carrier Strategy Alignment | Compare carrier performance by premium, revenue, commission, and CAGR. Use this to guide partnership decisions and negotiations. |
| Seasonality & Forecasting | Visualize renewal cycles, revenue dips/spikes, and seasonal trends across years. Plan ahead with confidence. |
| Low-Yield Segment Detection | Find accounts with low commission and high effort using Account Size + % Commission filters. Optimize your book for profitability. |
| Historical Trend Storytelling | Tell the story of your agency’s growth or transformation using multi-year charts and targeted filters. Ideal for leadership reporting. |
| New Business vs. Renewal Analysis | Use Renewal Month and LOB filters to segment performance over time and differentiate between growth from new production vs. retention. |
Summary
The Due Diligence Report in Harmony brings together comprehensive performance data with powerful, flexible filtering—giving you an enterprise-level view of your agency’s book of business. Whether you’re reviewing growth trajectories, analyzing commission structures, or preparing for strategic planning, this report equips you with the tools to make smart, data-backed decisions.
By combining historical insight with real-time intelligence, you're no longer just reporting the past—you're shaping the future.

