
Revenue Tuner in Harmony: Filter, Explore, and Export with Confidence
What is Revenue Tuner?
Revenue Tuner is a powerful reporting tool available in the Harmony platform, built to help Networks and Brokers analyze and manage performance across their agency partners.
In addition to viewing performance data from connected partner agencies, networks and brokers also have insight into the data of prospect agencies. This enhanced visibility supports more informed recruitment efforts, enables benchmarking against current partners, and helps networks strategically identify high-potential additions to their ecosystem.
The Revenue Tuner brings together data from the agencies’ book of business and production reports, providing a clear, consolidated view of premium volume, compensation trends, and business mix across the organization.
Revenue Tuner transforms submitted data into a highly interactive dashboard that makes it easy to filter, explore, and take action on performance insights.
Whether you're overseeing a large network or supporting individual agencies, Revenue Tuner equips you with dynamic tools to guide strategic growth and carrier conversations.
Revenue Tuner is also available in Understanding, tailored for agency-level views—but this article focuses exclusively on the Harmony experience.
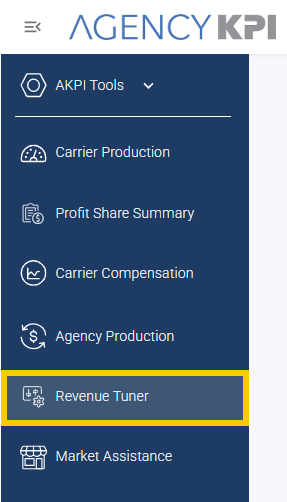
Note: Revenue Tuner requires a subscription update. If you don’t see it listed in your Harmony sidebar or want to enable access, reach out to us at [email protected].
Understanding the Data Source
All data displayed in Revenue Tuner comes directly from your agencies’ monthly AMS data uploads.
Each report is built by pairing two critical agency data sets:
-
Book of Business Report: Includes active customers and policies
-
Production Report: Captures billed premium and commission amounts on active policies
-
Life and Health data is now included
This combined data gives you a holistic, up-to-date view of agency performance across your network or brokerage—making it easy to compare trends, identify opportunities, and track outcomes.
Use Cases that Drive Engagement
Whether you're part of a network leadership team or work directly with agency partners, Revenue Tuner supports a wide range of use cases:
-
Benchmark performance across agencies or within your own book of business
-
Spot trends in premium volume, commission rates, and agency fees
-
Compare lines of business or focus on specific carrier relationships
-
Guide quarterly business reviews with exportable tables and visual summaries
-
Uncover growth opportunities through dynamic drill-downs and segmentation
Report Types: Networks and Brokers
There are two versions of the Revenue Tuner report in Harmony, based on organizational setup: one for networks and one for brokers.
-
The Network report provides a macro-level view of production performance across all agencies within the network, with the ability to drill down into individual agency data as needed.
-
The Broker report offers a micro-level view of the broker's entire book of business, and also allows users to filter into a specific agency for focused analysis.
Both versions offer the same core functionality—including dynamic filtering, live chart interactions, and exportable data—but the broker configuration includes access to additional account-level filters:
-
Producer
-
Account Manager
-
Account Name
These filters are not available in the network configuration.
This ensures that the report structure aligns appropriately with data access permissions and visibility expectations, allowing each user type to focus on the information most relevant to their role.
Interactive Filtering at Your Fingertips
Revenue Tuner’s strength lies in its interactivity. Visuals and filters work together to allow fluid data exploration—so you can find what you need fast.
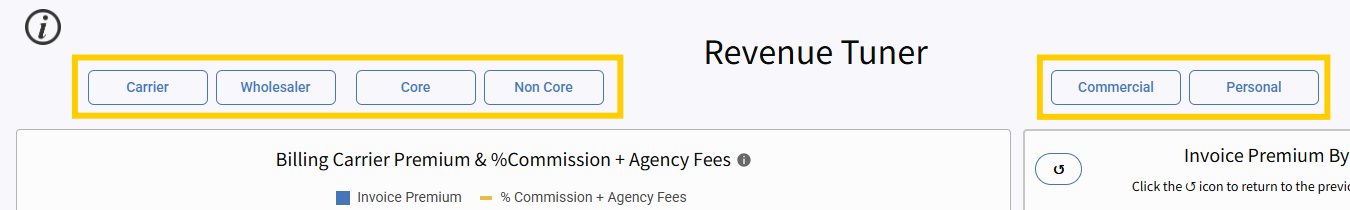
Top-Left Filters: Quick Access to Key Dimensions
At the top-left corner of the dashboard, you’ll see three grouped filters:
-
Carrier Type: Carrier or Wholesaler
-
Business Type: Core or Non-Core
-
Line of Business: Commercial or Personal
You can filter by a single category or combine selections across groups. These filters apply universally across the dashboard, updating all visualizations and tables instantly.
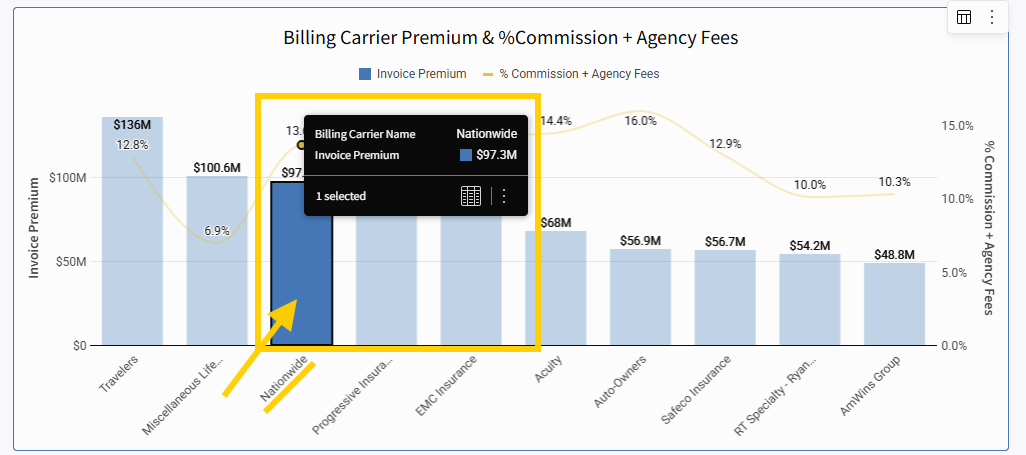
Billing Carrier Chart: Billing Carrier Premium & % Compensation + Agency Fees Insights
This dual-metric chart is at the heart of the dashboard:
-
Bar Graph: Displays Invoice Premium
-
Line Graph: Shows % Commission + Agency Fee
It’s also fully interactive:
-
Click a bar to filter to that carrier
-
Click a second bar to look at another carrier
-
Use the Clear Filters button at the top of the screen to reset
When filters are applied here, every element on the page updates accordingly.
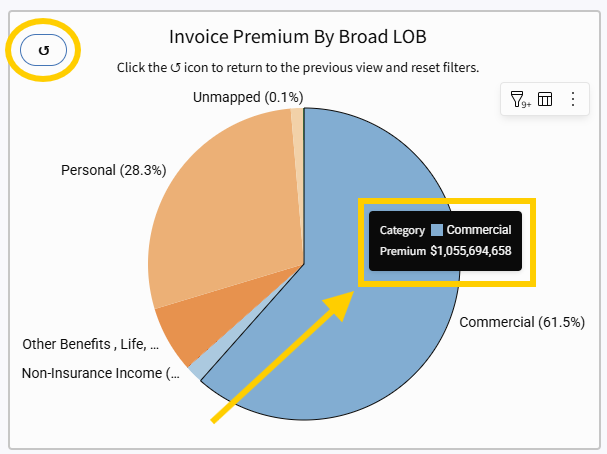
Pie Chart: Invoice Premium by Broad Line of Business
This chart provides a visual breakdown of premium by broad line of business. It also functions as a filter:
-
Click a slice to filter the dashboard
-
The effect applies to all tables and charts
-
Single-selection only: For multiple filters, use the full Filters Panel
-
Click the ↺ icon to return to the previous view and reset filters.
-
Use Clear Filters to reset
This behavior has changed—users can no longer multi-select directly from the pie chart.
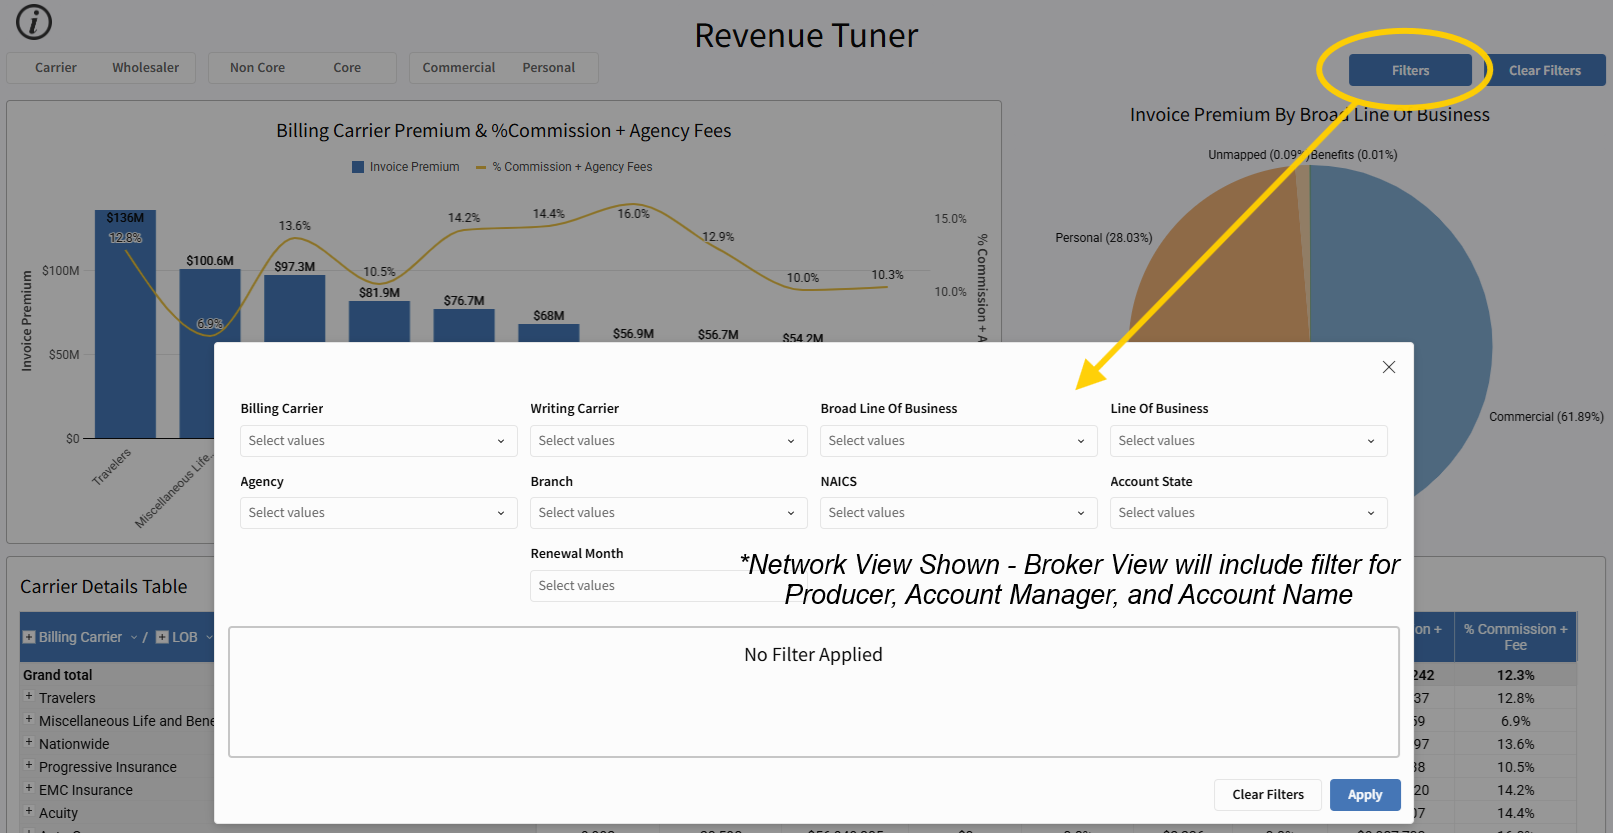
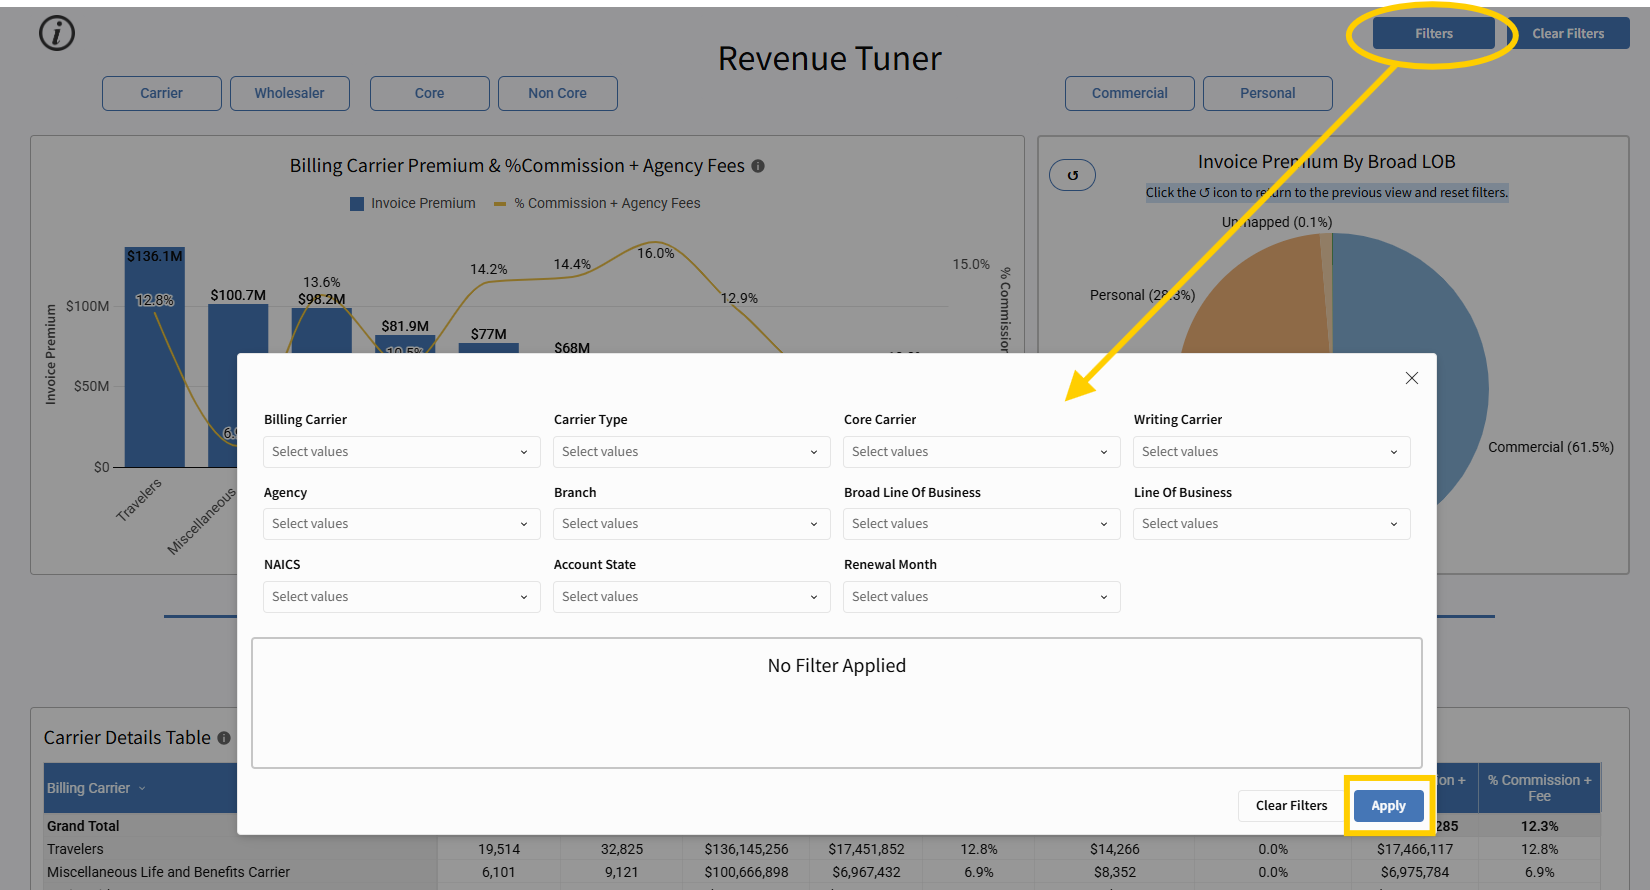
Filters Panel: Advanced Segmentation Options
Click the Filters button in the upper-right corner to access more granular filtering options. You can filter by:
-
Billing Carrier
-
Writing Carrier
-
Broad Line of Business
-
Line of Business
-
Agency
-
Branch
-
NAICS
-
Account State
-
Renewal Month
Multi-select is supported in each category. Once selections are made, click Apply.
To clear your filters, use the Clear Filters button at the top of the dashboard or within the Filters panel.
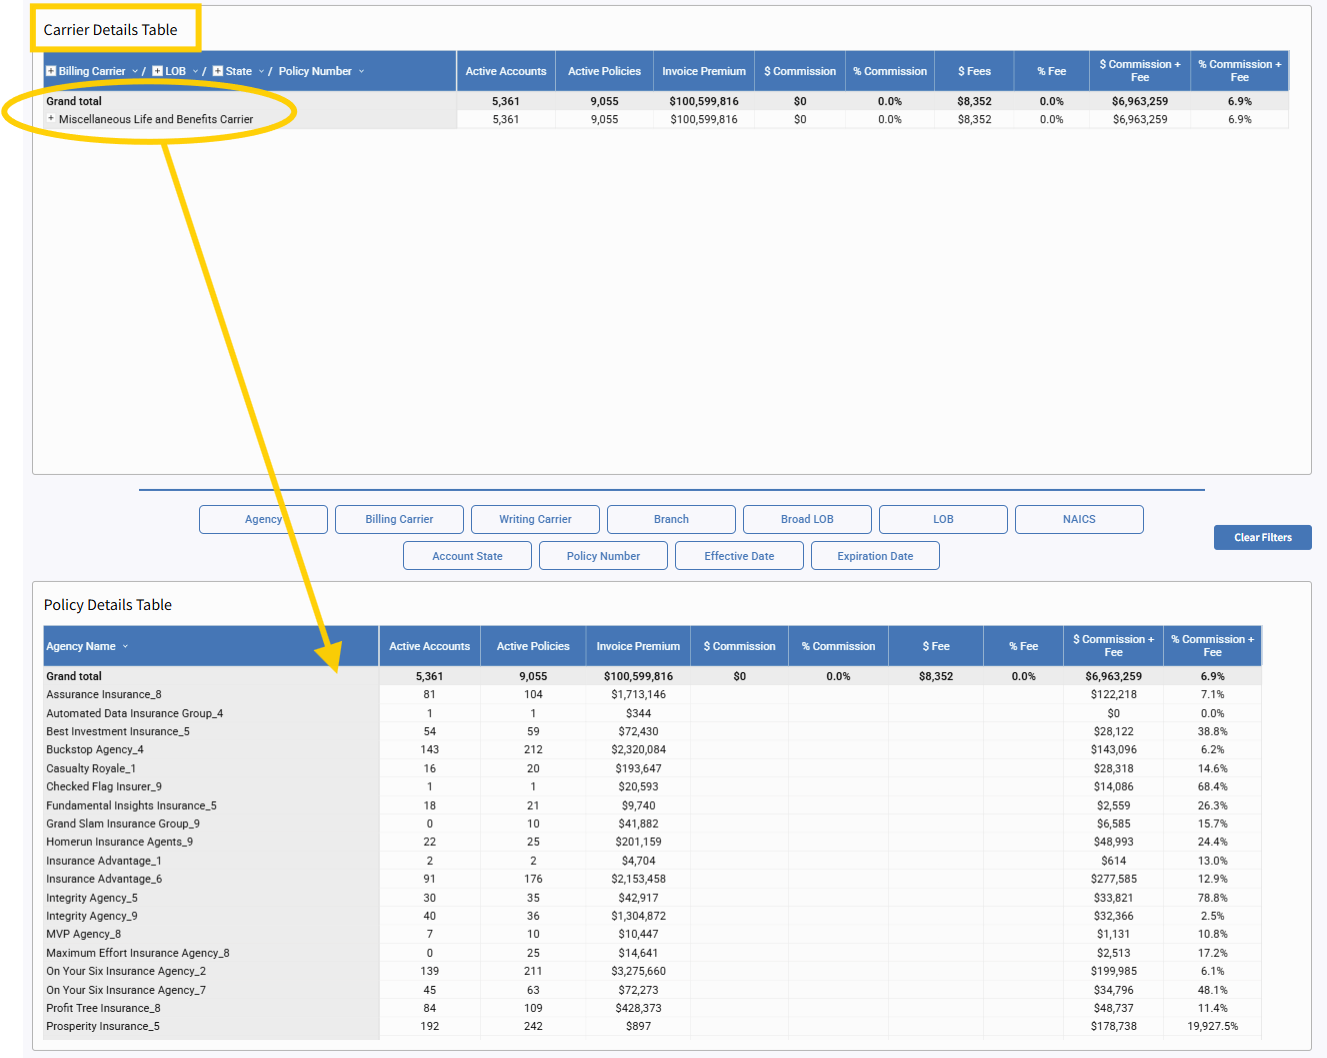
Carrier Details Table: Understand Performance by Carrier
The Carrier Details Table displays a breakdown of production performance across each carrier represented in the report. This table helps users evaluate not just total premium, but the revenue impact of commissions and fees.
The following metrics are included for each carrier:
-
Active Accounts
-
Active Policies
-
Invoice Premium
-
$ Commission
-
% Commission
-
$ Fees
-
% Fees
-
$ Commission + Fee
-
% Commission + Fee
This table is interactive and linked specifically to the Policy Details Table:
-
Click a carrier in the Carrier Details Table to filter the Policy Details Table to just those policies
-
Click a policy in the Policy Details Table to highlight the associated carrier(s) above
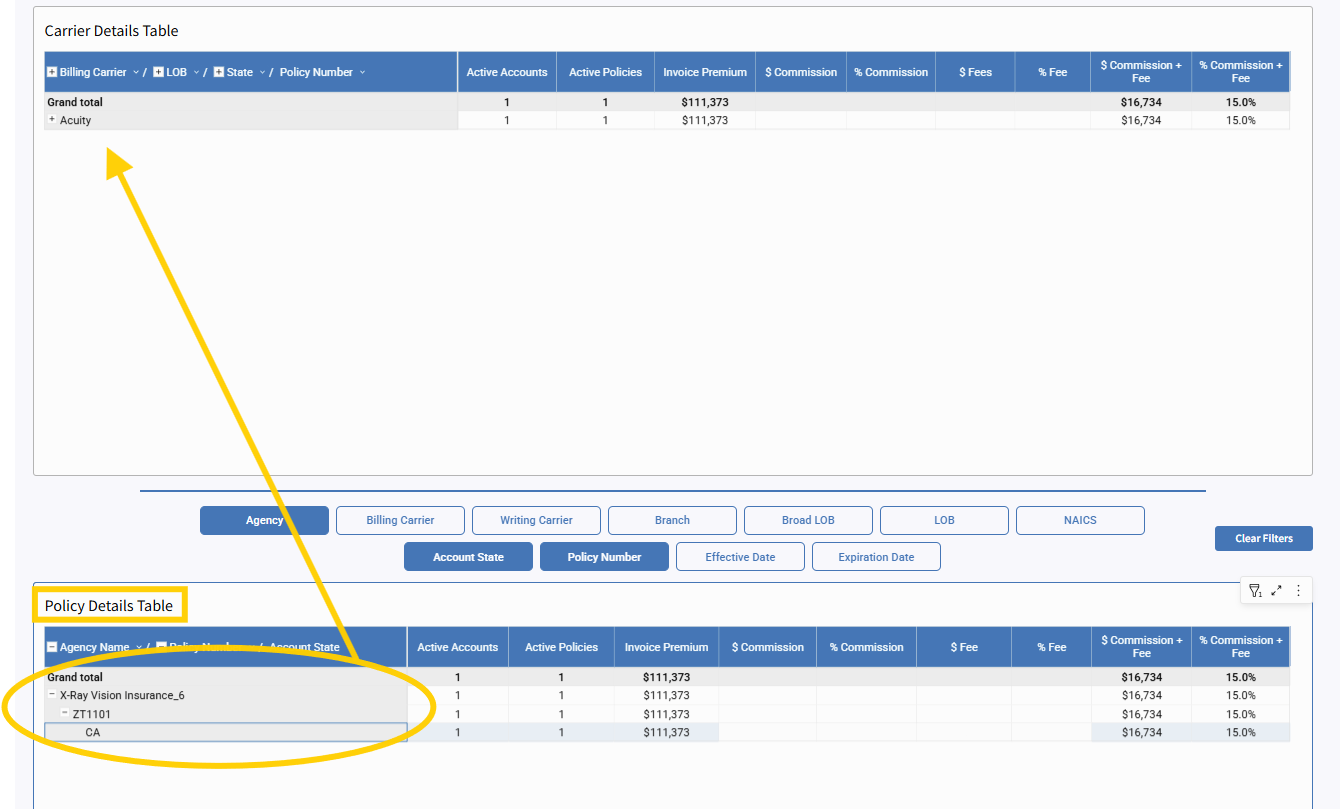
-
Filtering here does not affect the entire page, only the Policy Details Table
This interaction allows users to move between summary-level and policy-level insights seamlessly, making it easy to investigate carrier performance and validate supporting records.
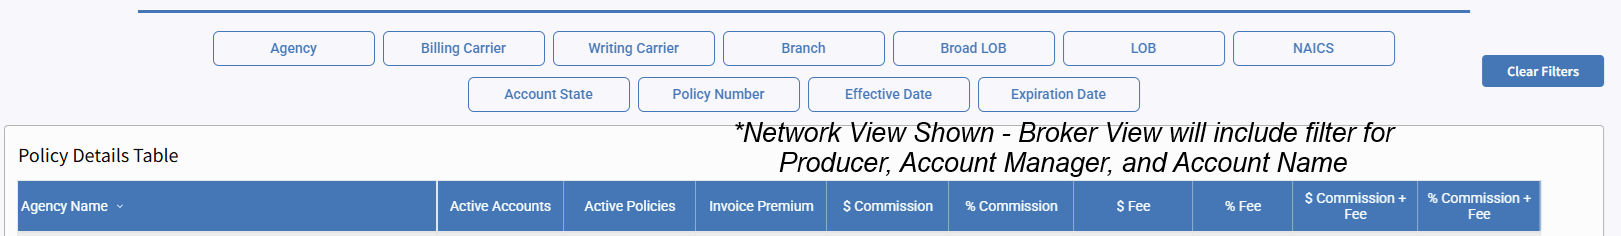
Policy Details Table: Drill Down with Precision
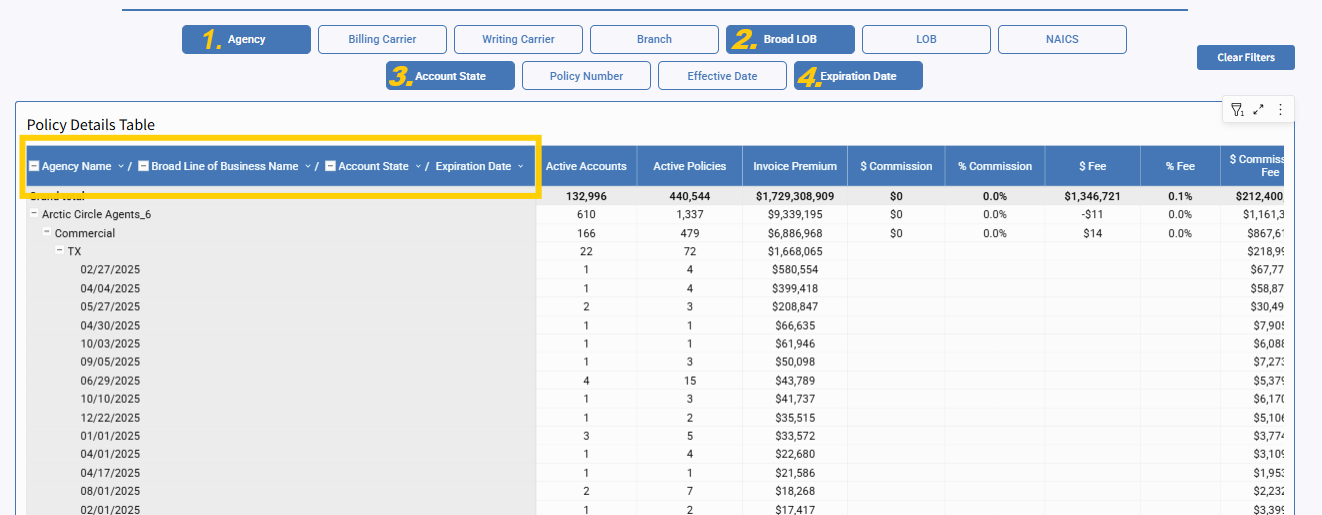
At the bottom of the report is the Policy Details Table, which provides a row-level view of all filtered results. It's also interactive:
-
Click to filter within the table by: Agency, Billing Carrier, Writing Carrier, Branch, Broad Line of Business, NAICS, Account State, Policy Number, Effective Date, and Expiration Date
-
Click again to unselect any value
-
The order in which you click determines the display order of filtered results
-
You can clear filters directly within the Policy Details Table at any time
This is an excellent tool for narrowing in on specific policy-level records, validating selections, and preparing exports—all without changing filters across the rest of the dashboard.
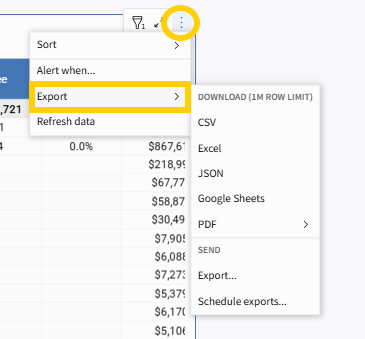
Exporting Data Tables
Every table in Revenue Tuner is exportable:
-
Click the three-dot menu in the top-right of any data table
-
Select Export and follow the prompts
-
Save or share as needed for carrier conversations, performance reviews, or internal use
Explore, Discover, and Grow
Revenue Tuner in Harmony isn’t just a report—it’s a launchpad for smarter strategy and stronger performance. Use the tools, interact with the visuals, apply filters, and export results. The more you explore, the more valuable insights you’ll uncover.
Need help interpreting your results or setting up custom filters? Our team is here to support—reach out anytime at [email protected].

