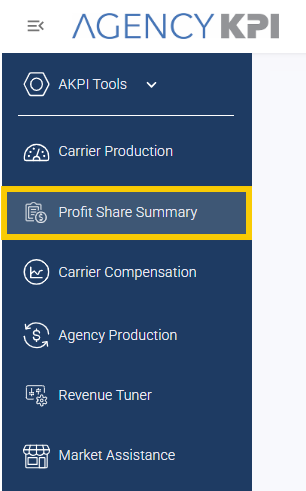
The Profit Share Summary report is designed for networks or brokers who have contingency or profit share agreements with specific carriers. It enables you to track performance with all your core carriers that have such agreements.
View Data by Carrier or by Agency
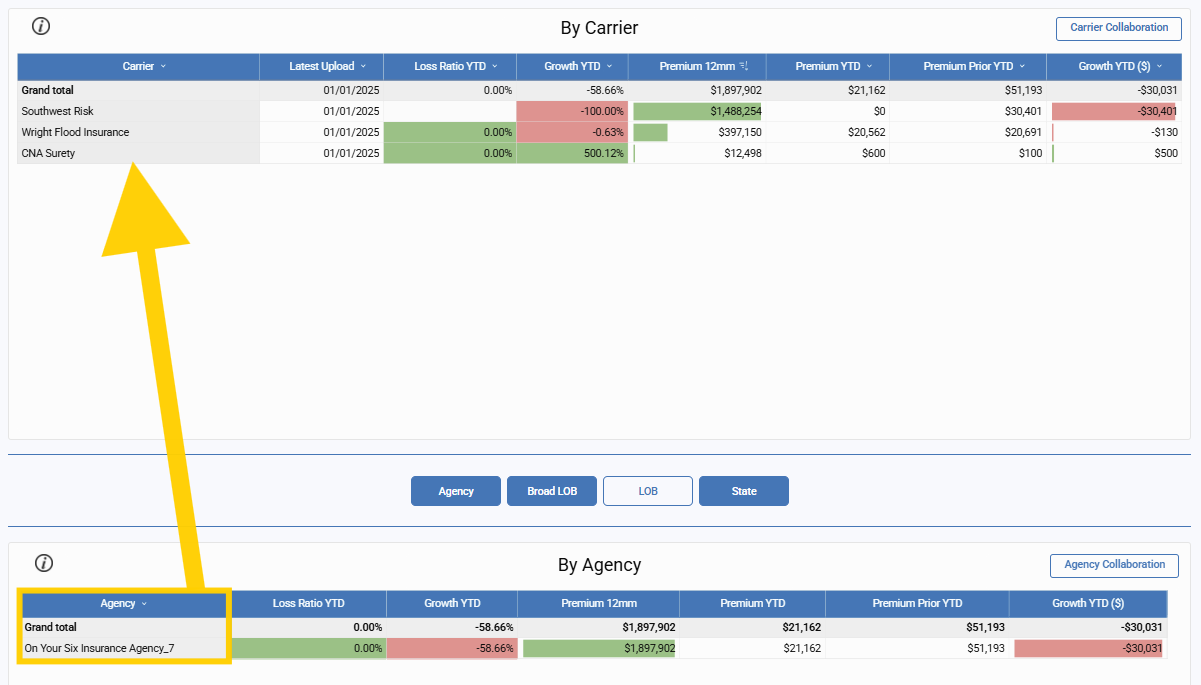
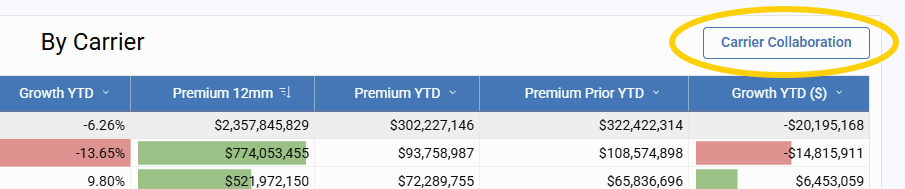
By Carrier Table
This table displays profit share-specific metrics for each carrier:
-
Last Upload Date
-
Loss Ratio YTD
-
Growth YTD
-
Premium 12MM
-
Premium YTD
-
Premium Prior YTD
-
Growth YTD ($)
Note: Profit Share Brackets are not currently included in this report. We recommend having those details accessible when reviewing this section.
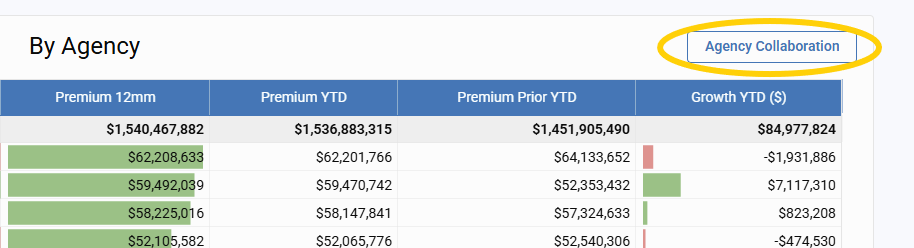
By Agency Table
This table includes performance metrics for each agency:
-
Loss Ratio YTD
-
Growth YTD
-
Premium 12MM
-
Premium YTD
-
Premium Prior YTD
-
Growth YTD ($)
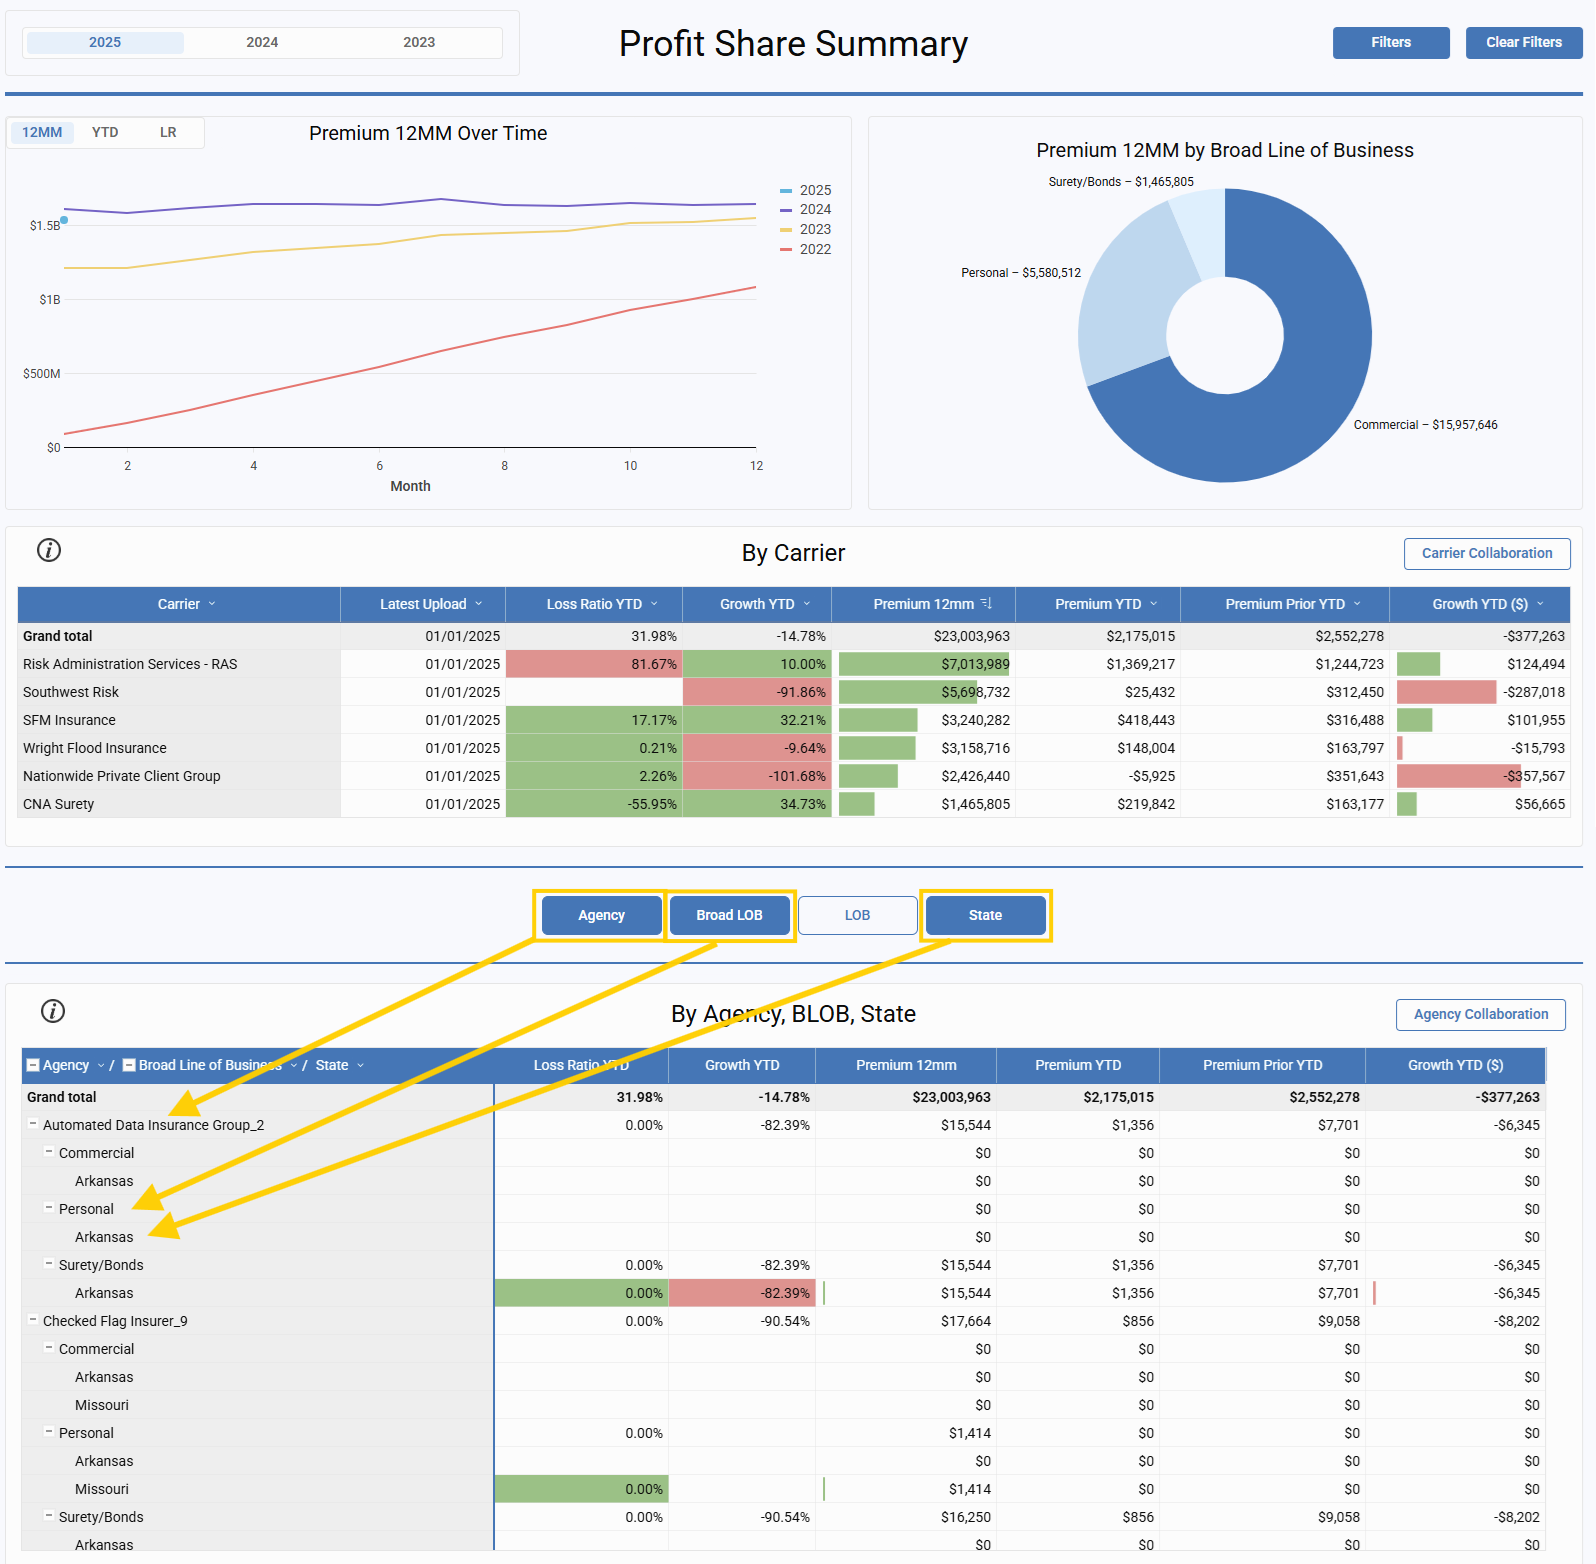
You can filter and sort this data by:
-
Agency
-
Broad Line of Business (LOB)
-
LOB
-
State (Agency Domicile State)
These filters are multi-selectable, and the order you select them determines the display order of the results.
Data Sources and Table Interaction
All data in this report is sourced from Core Carrier Production reports, which are uploaded monthly by the network or aggregator.
-
Blank cells indicate the value is not present in the Carrier Production report.
-
A value of $0 represents an actual zero reported by the carrier.
Interactive Filtering
-
Click any Carrier name to filter the Agency table accordingly.
-
Click any Agency name to filter the Carrier table.
-
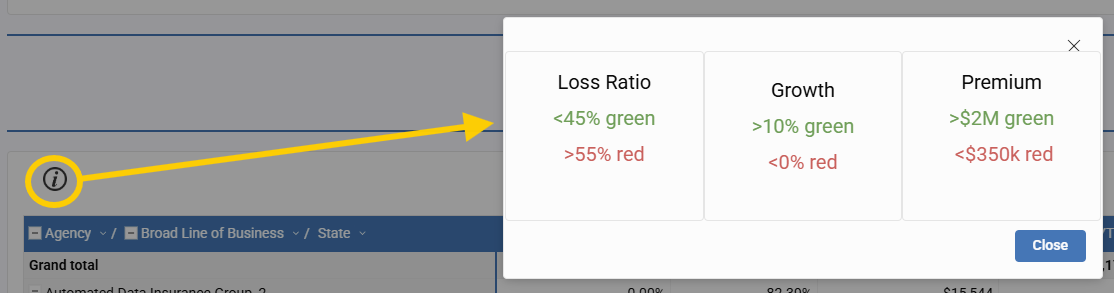
Use the “i” Info icon for a quick reference to color coding.
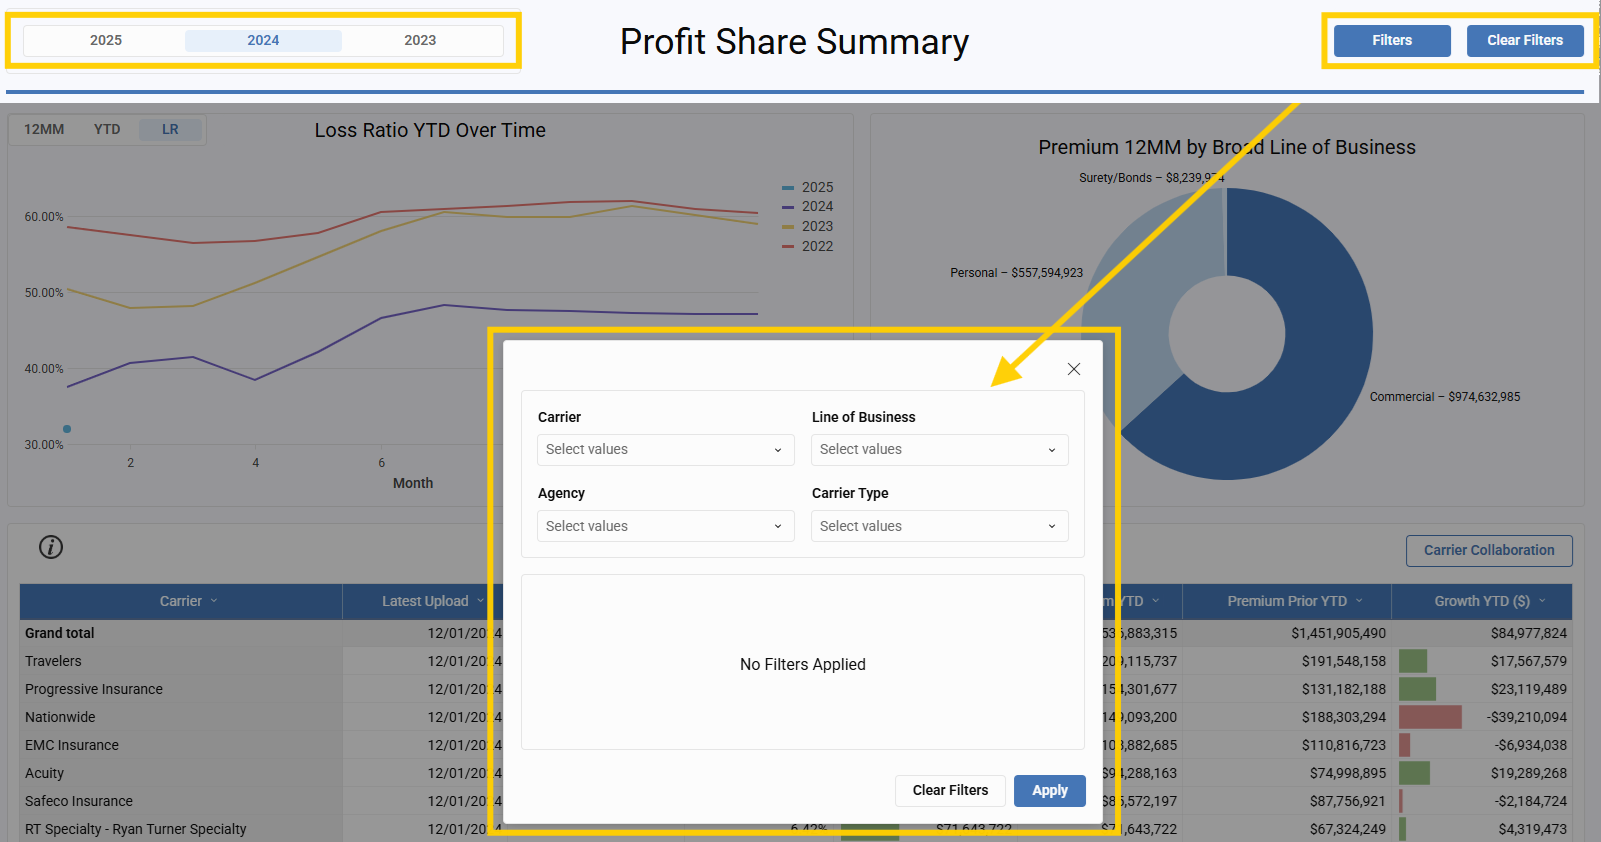
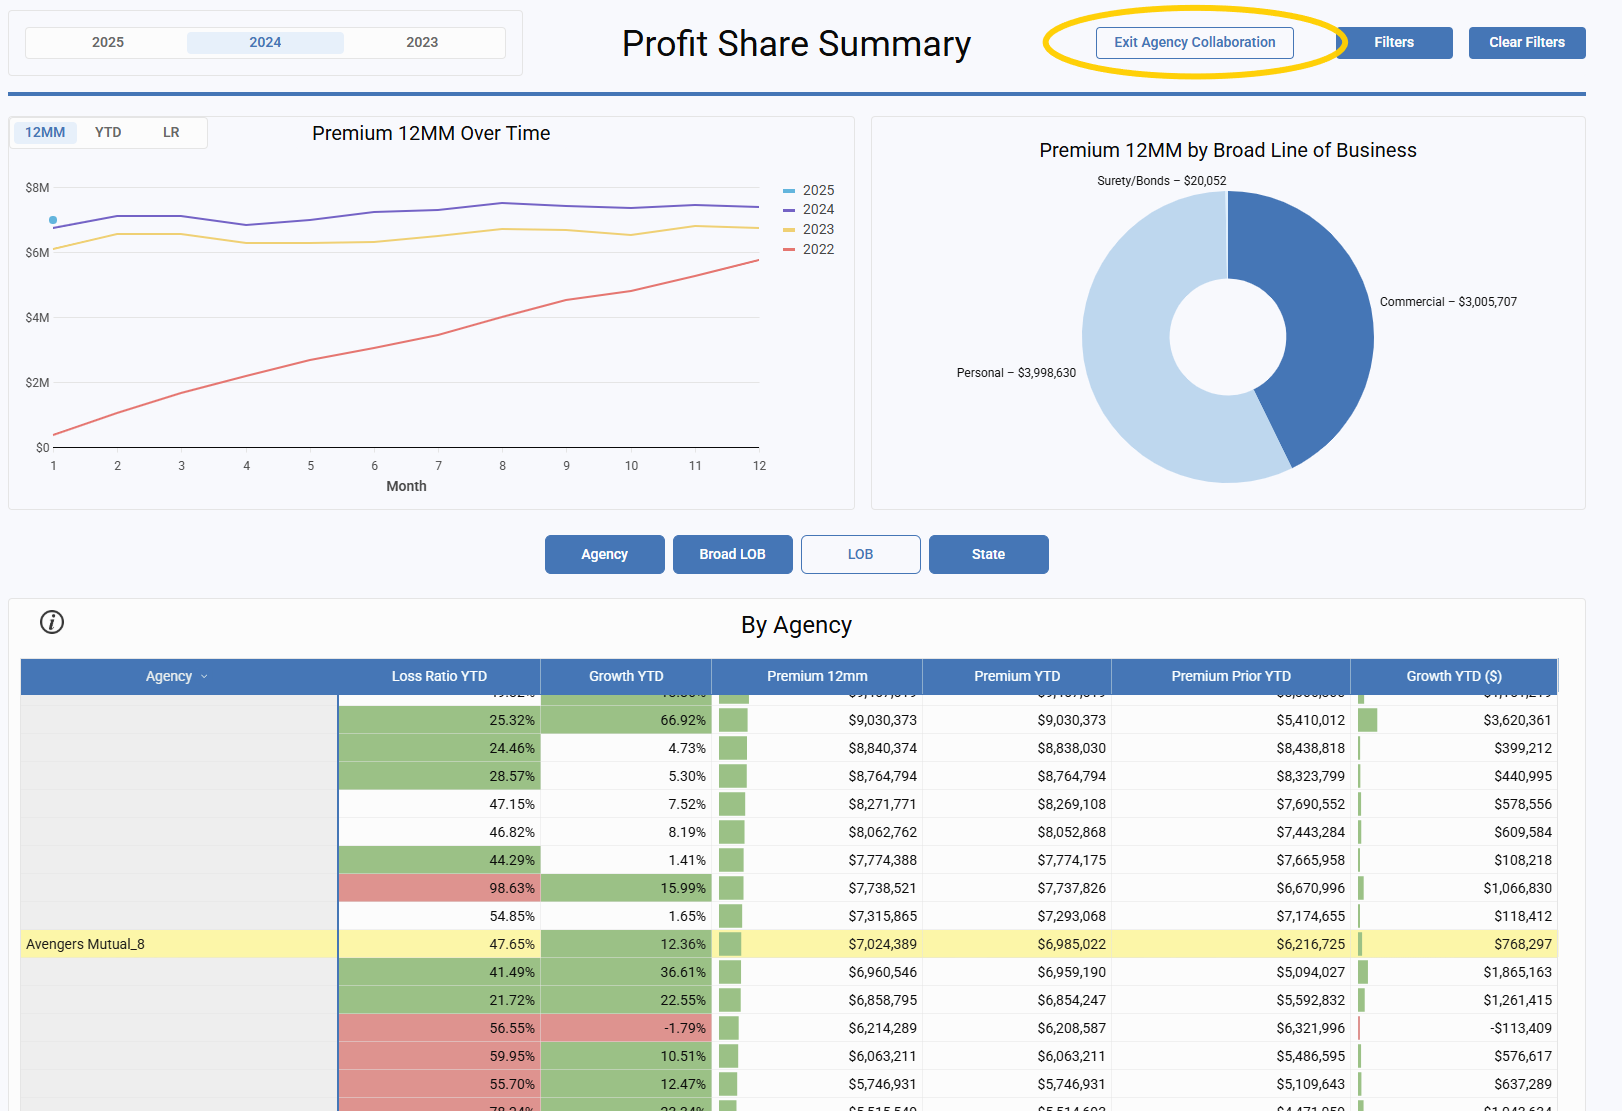
View Data by Year & Filter the Page
Global Page Filters
Use the filters at the top of the page to apply changes across the entire report.
-
Select the Year (upper-left).
-
Click "Filters" to choose:
-
Carrier(s)
-
Line(s) of Business
-
Agency Name(s)
-
Carrier Type(s)
-
-
Click Apply to view results.
-
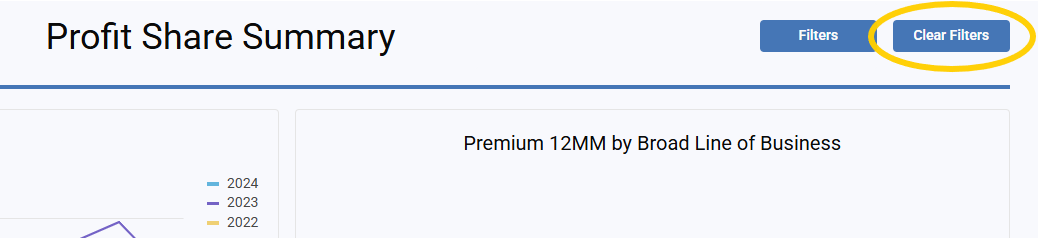
Simply click Clear Filters to start again.
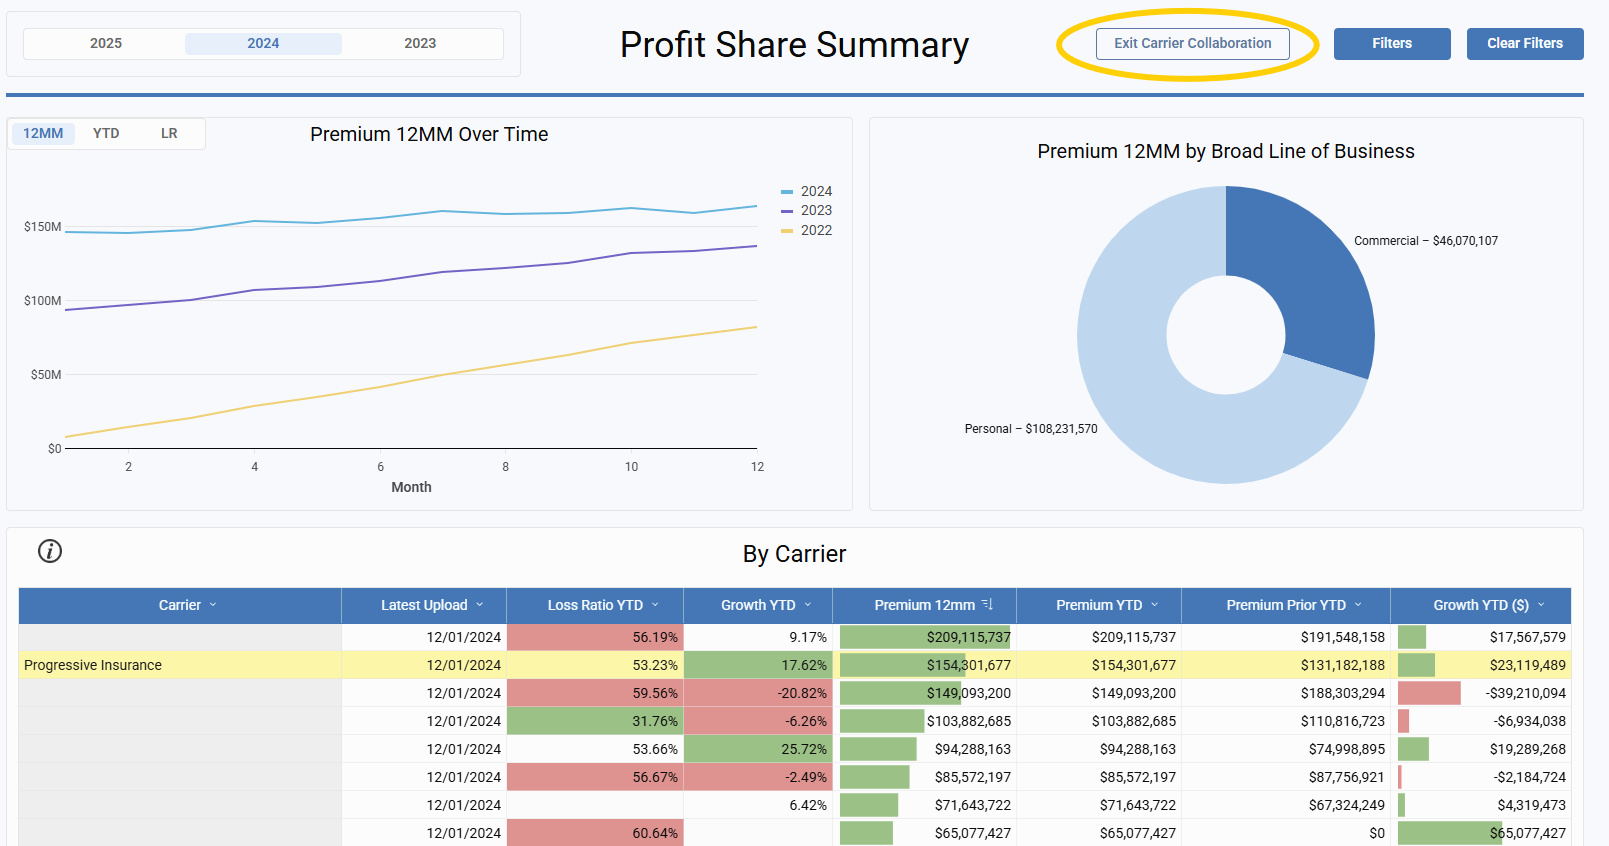
Bar Graph Options
Choose how to view the bar graph data at the top of the page:
-
12MM (Premium Over Time)
-
YTD (Premium Over Time)
-
LR (Loss Ratio Over Time)
The bar graph compares the current year to the three prior years. Hover over any month to view detailed tooltips in the summary box.
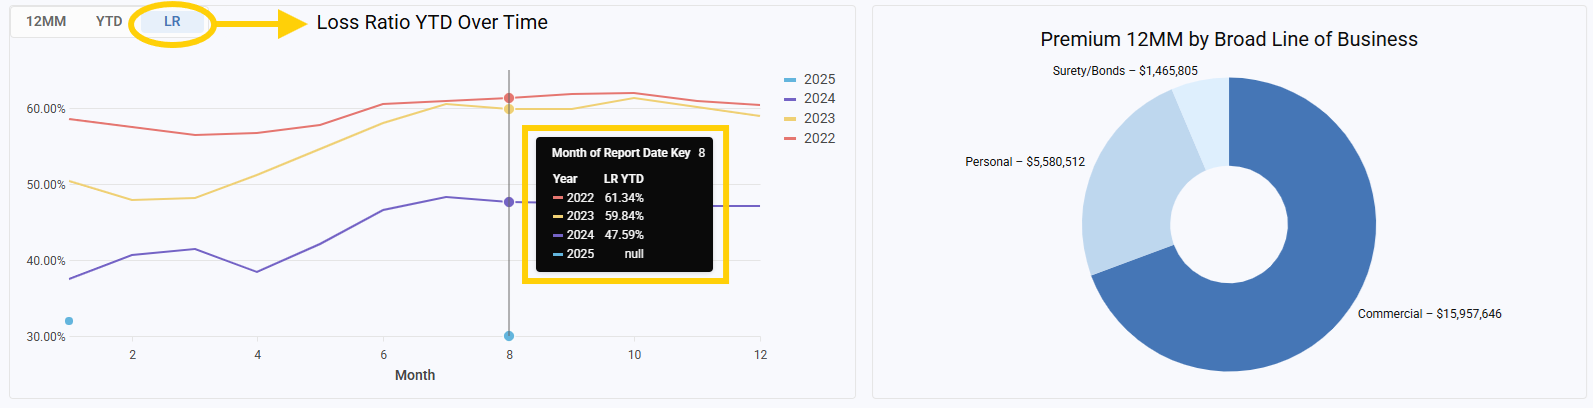
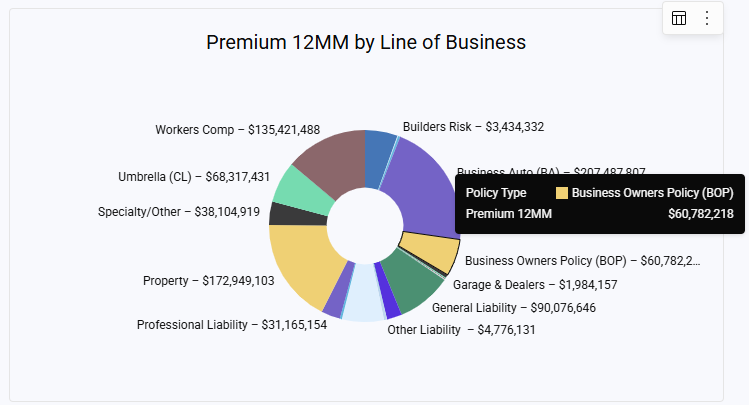
Using the Pie Chart
The pie chart functions as a filter as well:
-
Click on any slice to filter.
-
To reset, click Clear Filters at the top of the page.
-
Hover over chart sections for more details in the black hover box.
Carrier and Agency Collaboration
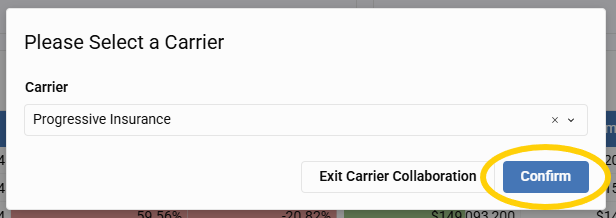
Carrier Collaboration Mode
-
Click Carrier Collaboration in the Carrier table.
-
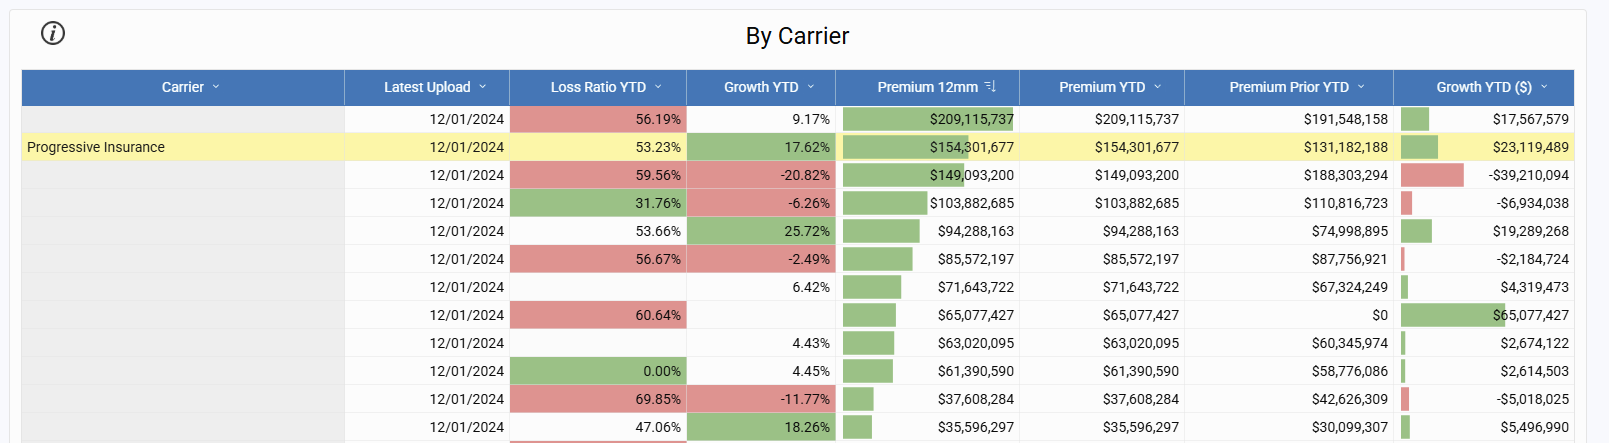
Select a specific Carrier to display—others Carrier names will be hidden.
-
Sort the table as needed.
-
Click Exit Carrier Collaboration (top right) to return to full view.
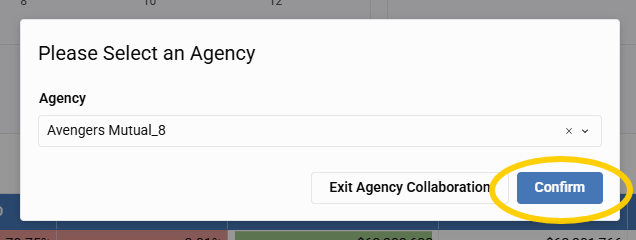
Agency Collaboration Mode
-
Click Agency Collaboration in the Agency table.
-
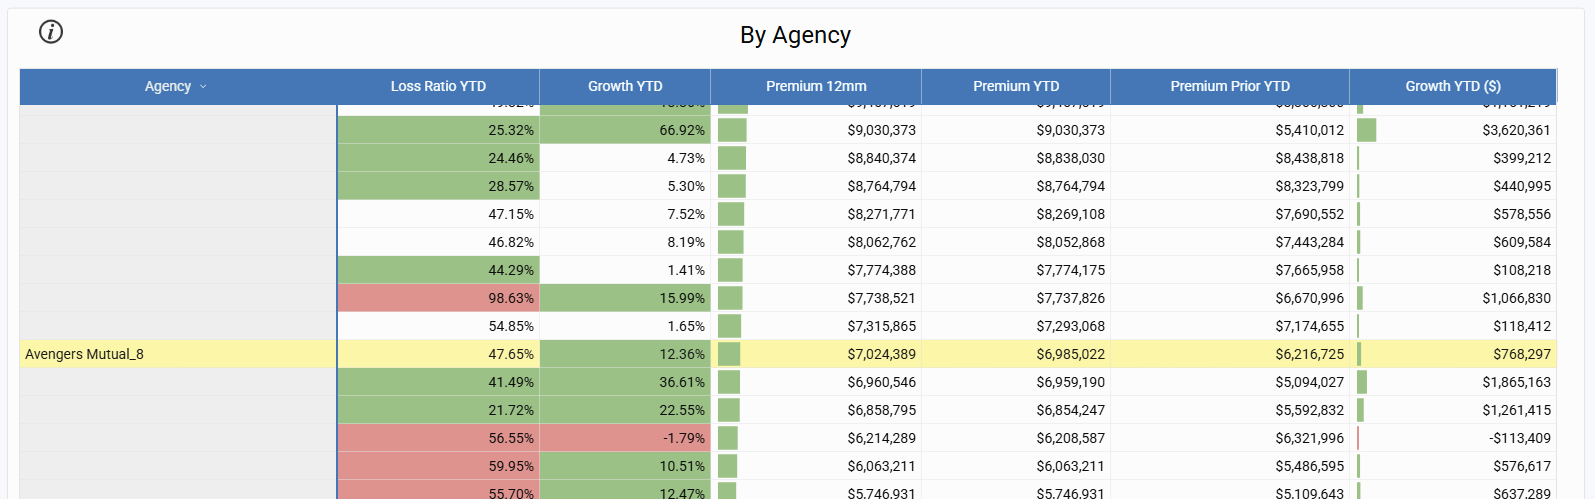
Select a specific Agency to display.
-
Other agencies names will be hidden, allowing focused sorting.
-
Click Exit Agency Collaboration (top right) to return to the full view.
Profit Share Summary: Example Use Case
There are two interactive tables—one for Carriers and one for Agencies.
-
If you’re reviewing a specific Carrier, click its name to filter the Agency table. Then sort by Growth or Loss Ratio to identify top performers or agencies needing attention.
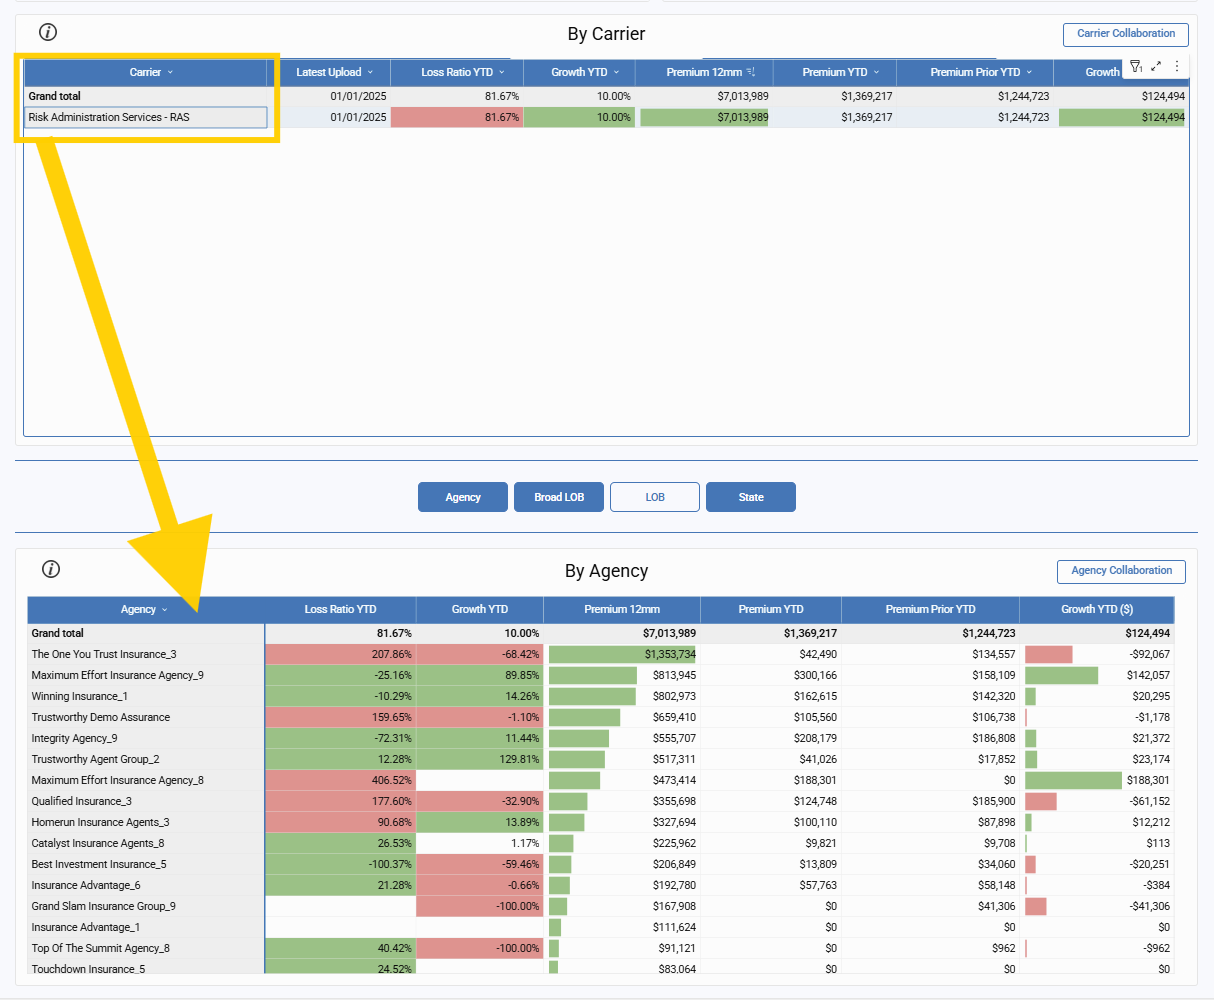
-
Conversely, click an Agency name to see all Carriers that agency is contributing to.