Performance Charts & Graphs

May 21, 2025
![]()
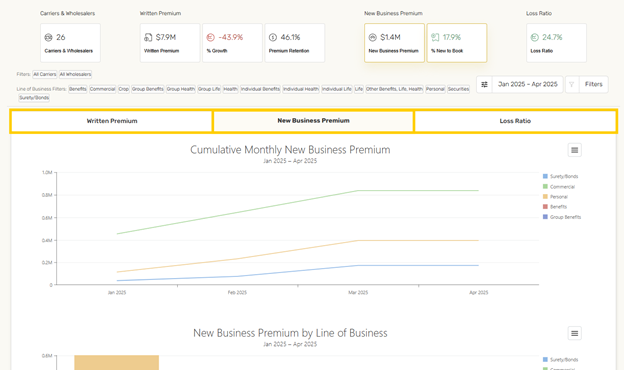
Performance Charts & Graphs data comes from the Carrier Production reports that have been supplied by your Network or Aggregator.
- Click the boxes to view graphics by Written Premium, New Business Premium or Loss Ratio.
![]()
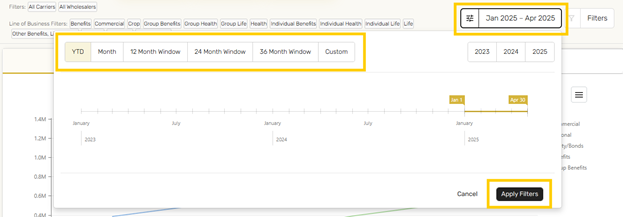
- Click the date in the upper right corner to adjust the time frame displayed
![]()
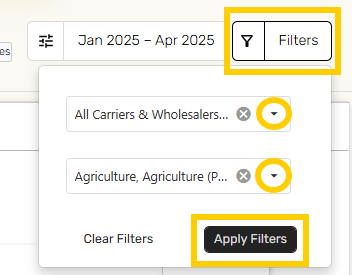
Click the Filters button to make selections from "All Carriers & Wholesalers" pull-down menu or the "Line of Business" pull-down menu
- Make selections and click Apply Filters
- Click Clear Filters to remove selections
![]()
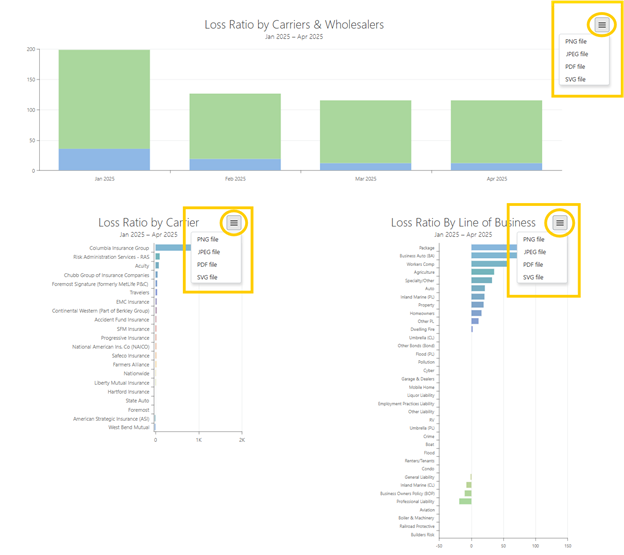
The Performance Charts and Graphs can be downloaded as PNG, JPEG, PDF or SVG files. Click the hamburger icon ![]() to choose the desired format from the drop-down menu and the file will automatically download.
to choose the desired format from the drop-down menu and the file will automatically download.
![]()

