
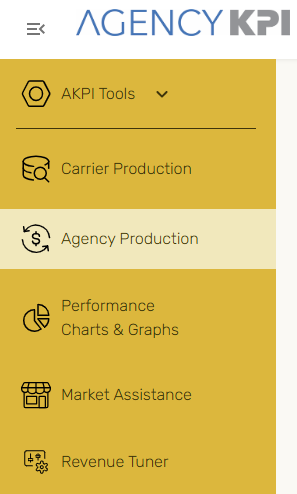
The Agency Production report in Understanding gives you the power to analyze production trends across all carriers and lines of business in a single, unified view. Whether you're focused on commissions, policies, or producers, this page provides a high-impact way to drill into what matters most—by account, branch, or even transaction type.
With flexible filters, customizable tables, and insightful metric options, you can tell the full story of your agency’s performance in just a few clicks.
Key Page Features
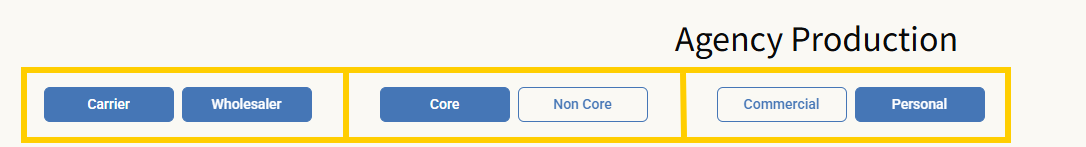
Top-Level Filters (Top Left)
This section includes three multi-select filter sets that instantly shape the report's focus:
-
Carrier / Wholesaler
-
Core / Non-Core
-
Commercial / Personal
These filters impact all data on the page, including the top cards, Detail Table, and Monthly Details.
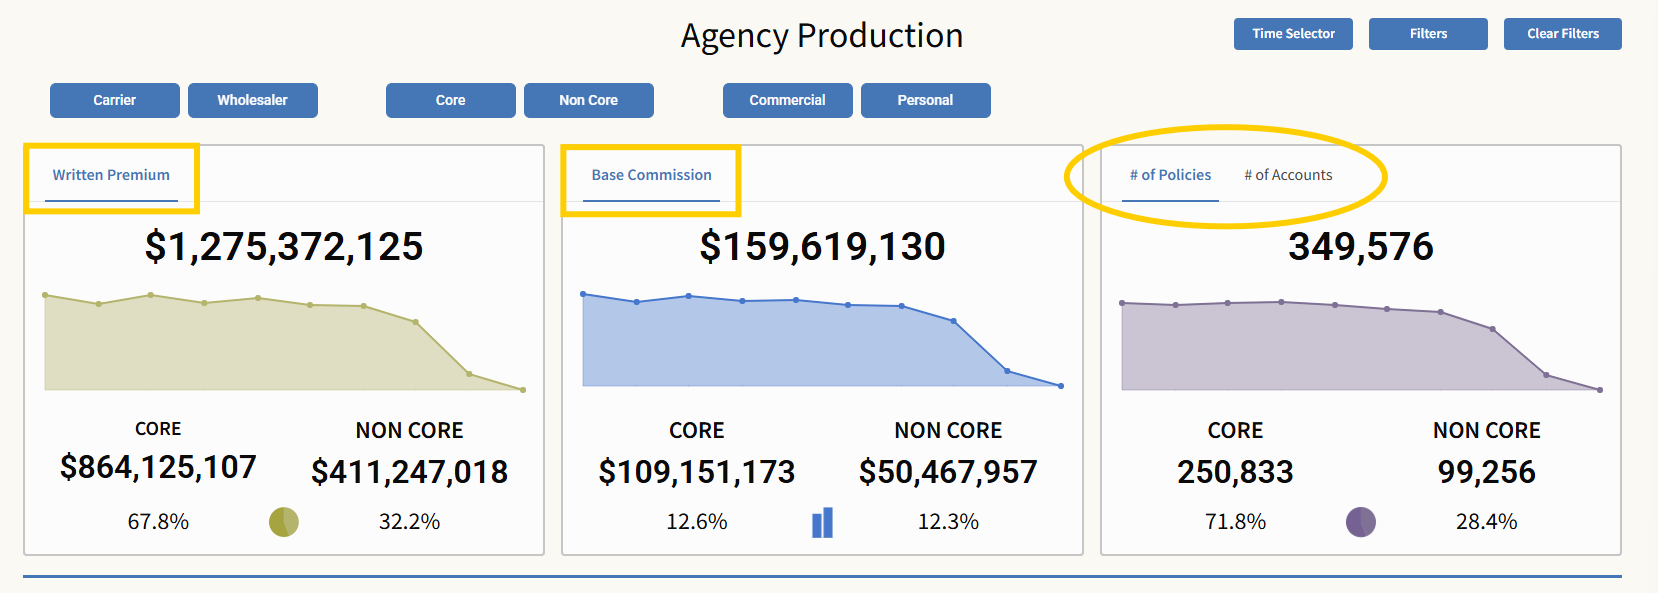
Performance Summary Cards (Top Center)
The summary cards give you a high-level view of production metrics, updating based on all filters and time selections applied.
Metrics available:
-
Written Premium
-
Base Commission
-
# of Policies (or toggle to select) # of Accounts
Detailed Table (Middle Section)
The Details table provides in-depth insight by allowing you to slice and dice data across multiple selectable dimensions. You can select one or many from the following fields:
-
Account
-
Billing Carrier
-
Core/Non-Core
-
Writing Carrier
-
Branch
-
Broad Line of Business
-
Line of Business
-
Account Manager
-
Producer
-
Account State
-
NAICS
-
Policy Number
-
Billing Method
-
Transaction Type
-
Effective Date
-
Expiration Date
Selections are shown in the order chosen. To remove Account Name as the primary header, it must be unselected first.
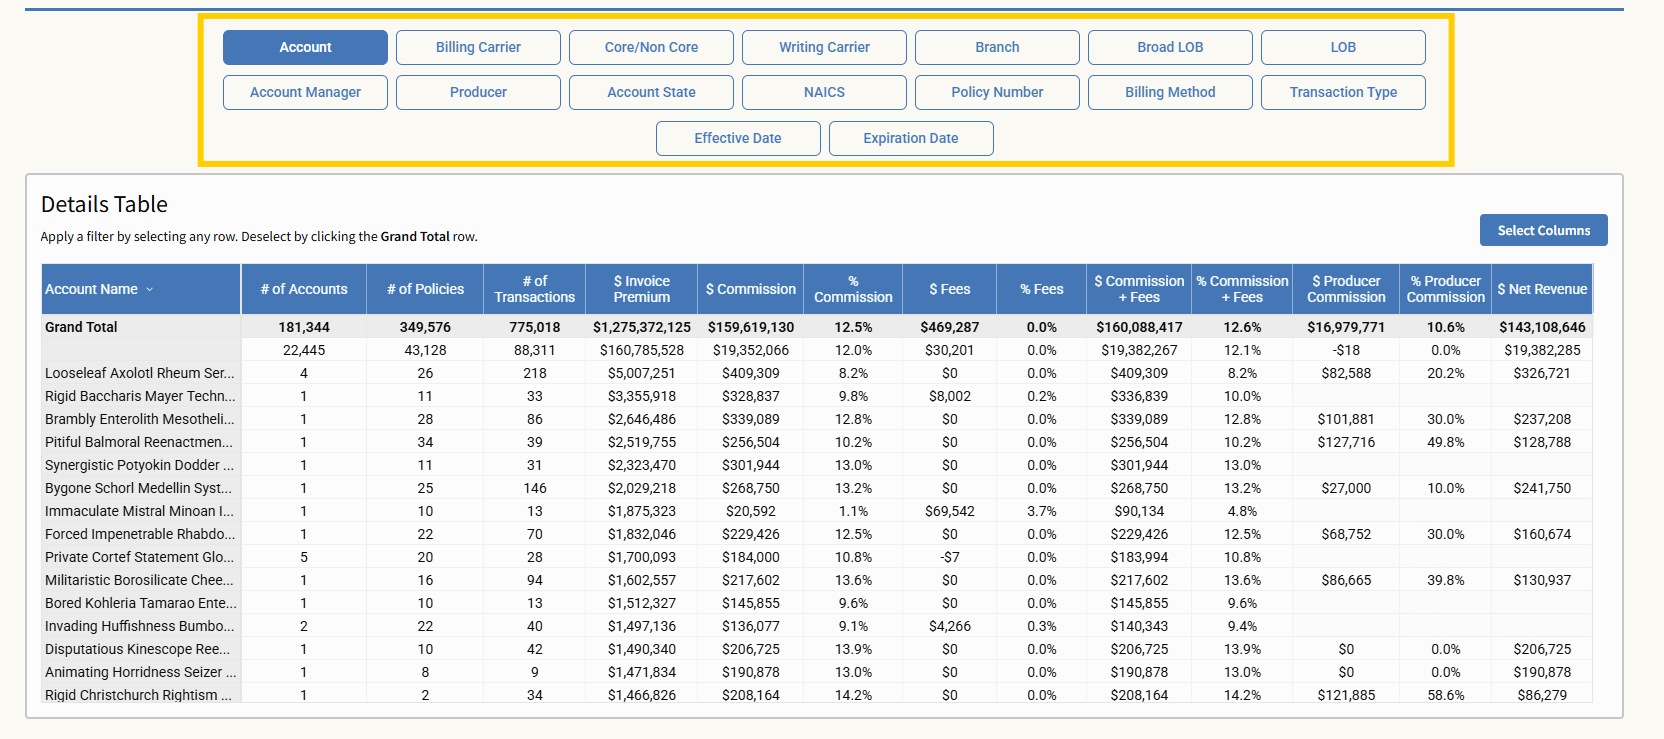
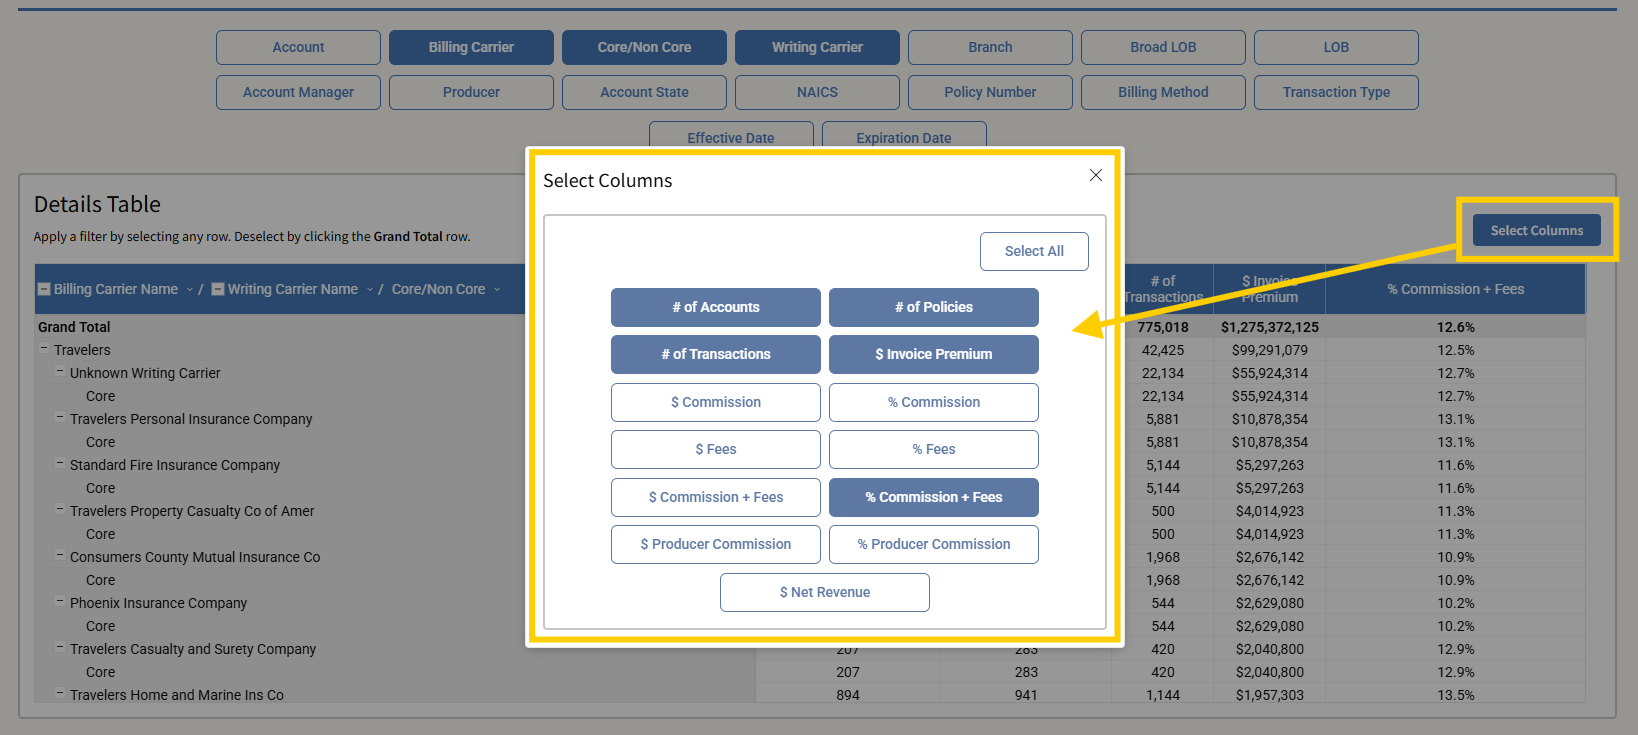
Column Customization
Click "Select Columns" (upper-right of the table) to choose which metrics appear:
-
of Accounts
-
of Policies
-
of Transactions
-
$ Invoice Premium
-
$ Commission
-
% Commission
-
$ Fees
-
% Fees
-
$ Commission + Fees
-
% Commission + Fees
-
$ Producer Commission
-
% Producer Commission
-
$ Net Revenue
You may deselect all columns to start fresh. When done, click the X to close the selector window. To revise, reopen Select Columns, or click Reset to reset the entire page to default.
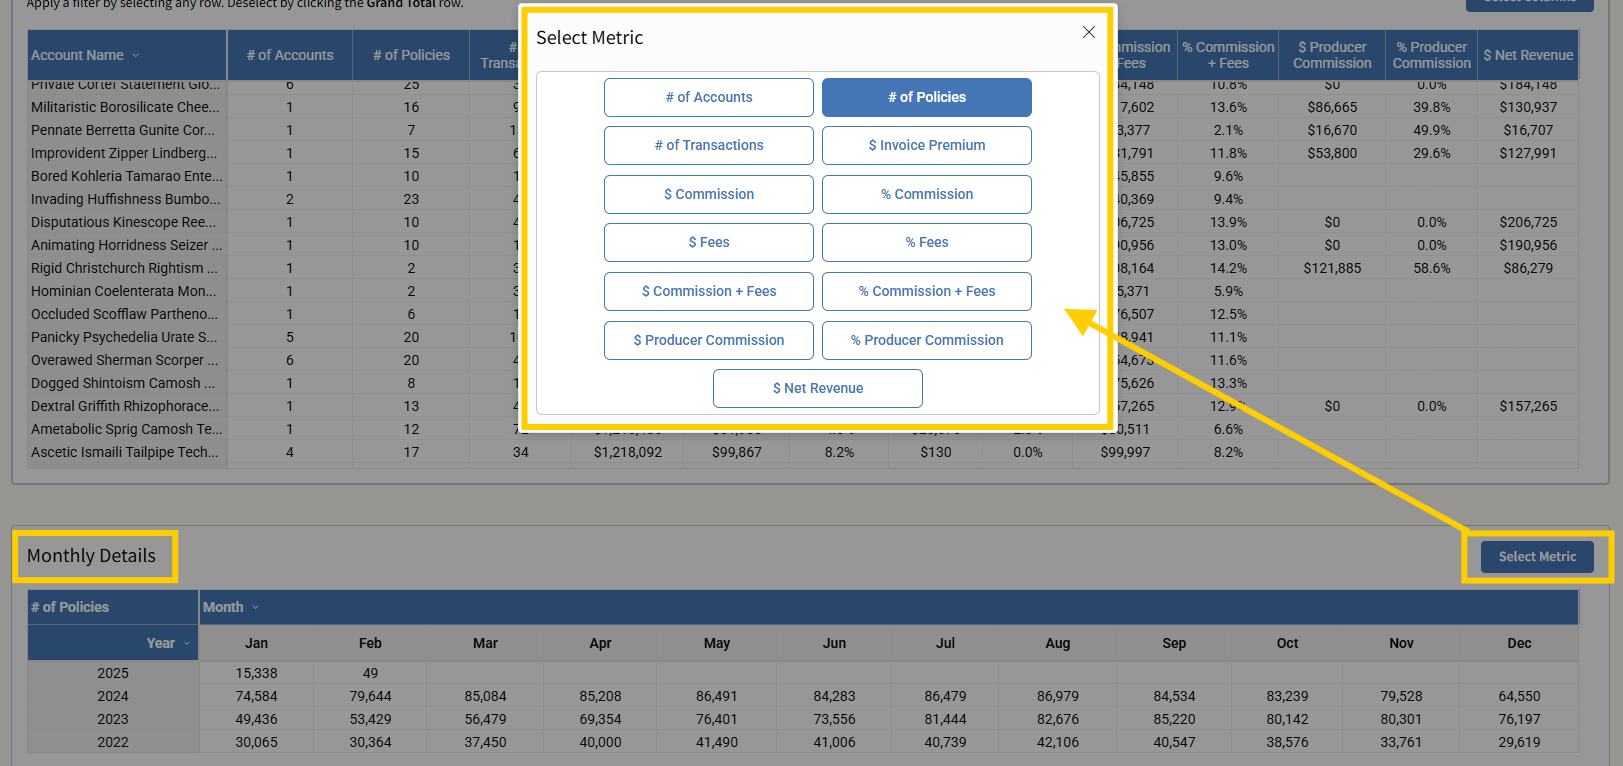
Monthly Details Table (Bottom Section)
This table tracks $ Commission + Fees by default, broken out by year and month. The selector in the top-right lets you view other individual metrics (single-select only):
-
of Accounts
-
of Policies
-
of Transactions
-
$ Invoice Premium
-
$ Commission
-
% Commission
-
$ Fees
-
% Fees
-
$ Commission + Fees
-
% Commission + Fees
-
$ Producer Commission
-
% Producer Commission
-
$ Net Revenue
Use the X to close the selector after choosing a metric. Reopen “Select Metrics” to edit.
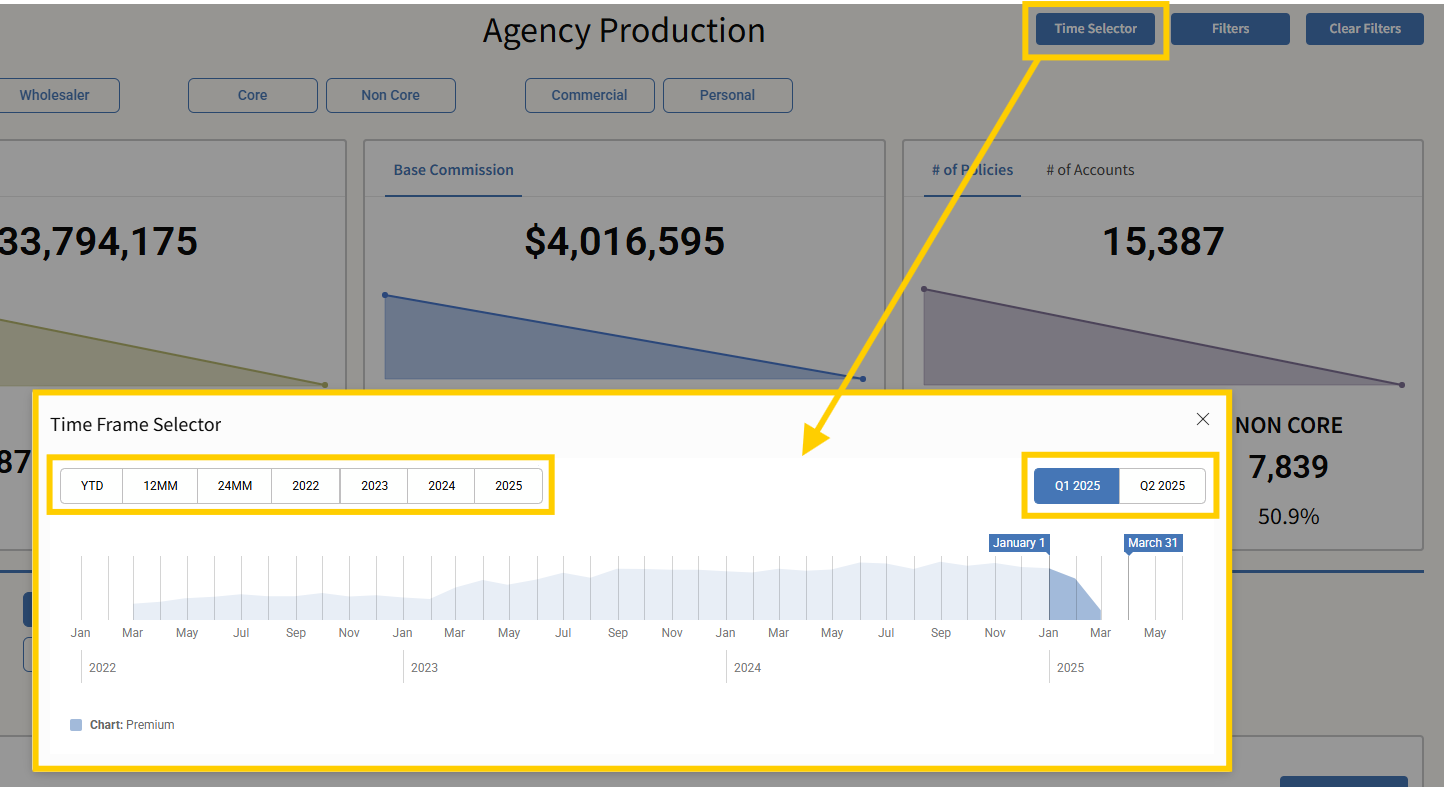
Time Selector (Top Right)
Adjust the reporting period using:
-
Predefined Ranges: YTD, 12MM, 24MM, 2022, 2023, 2024, 2025
-
Quarter Filter: Further narrow the selected time range by quarter
-
Manual Selection: Drag and drop on the line graph to set a custom date range
Close the selector with the X, and reopen as needed to refine.
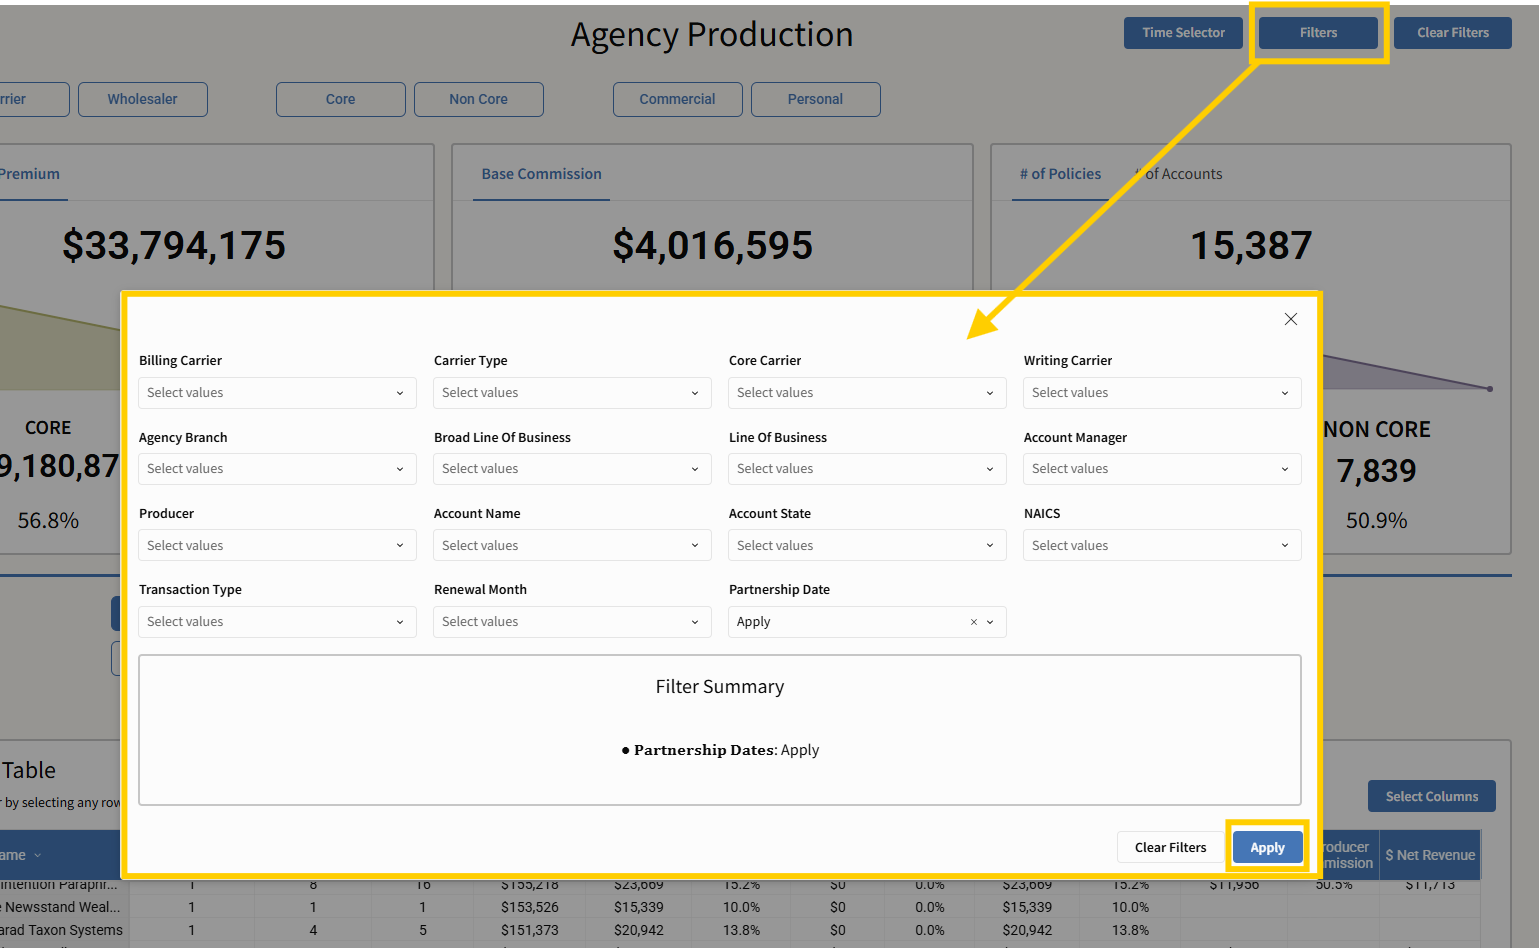
Filter Panel (Next to Time Selector)
Click Filter to open additional agency-level filtering options. You can filter by:
-
Billing Carrier
-
Carrier Type
-
Core Carrier
-
Writing Carrier
-
Agency Branch
-
Broad LOB
-
Line of Business
-
Account Manager
-
Producer
-
Account Name
-
Account State
-
NAICS
-
Transaction Type
-
Renewal Month
-
Partnership Date
Click Apply to refresh the page with the selected criteria.
Note: "Clearing filters" will only reset the top three filter sections (Carrier/Wholesaler, Core/Non-Core, Commercial/Personal). Other filters remain unless you choose "reset."
Downloading Tables
You can download any data table on this page for further analysis, archiving, or presentation.
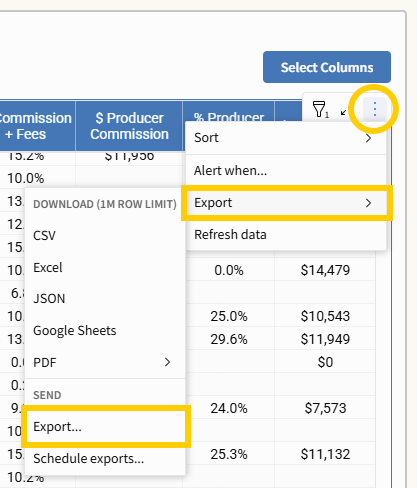
How to Export:
-
Hover over the table you want to export (either the Details Table or Monthly Details Table).
-
Click the three-dot menu in the upper-right corner of the table.
-
Select Export.
If you’ve formatted or customized the table, additional steps are recommended to preserve your layout and headings.
For Formatted Tables:
-
Click Export again in the send section.
-
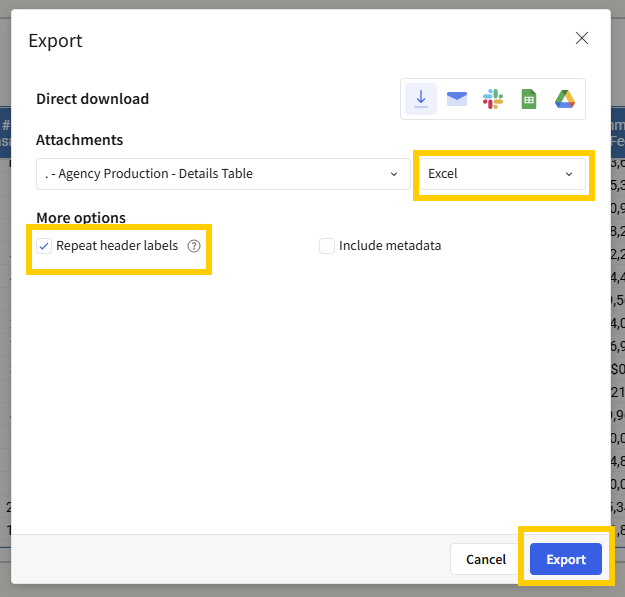
A new window will open. From here:
-
Select Excel as the file format.
-
Choose the option to Repeat Header Labels.
-
-
Click Export once more to finalize and download your file.
This ensures that any filtered or customized view—including selected columns or metrics—is preserved in the exported version.
Bookmarking Your View
To streamline your workflow and avoid repeating filter setups, you can save custom views as bookmarks and return to them anytime.
How to Save a Bookmark
-
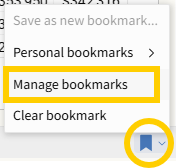
Look for the gray bar at the bottom of the page.
-
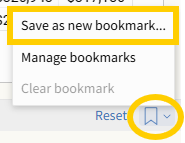
In the right-hand corner, click the ribbon icon.
-
From the options presented, select “Save as new bookmark.”
-
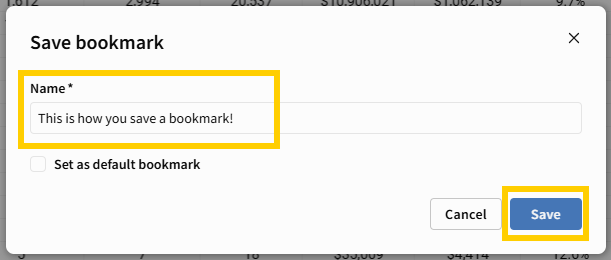
A Save Bookmark modal will appear:
-
Enter a custom name for your bookmark.
-
(Optional) To make this your new default view, check “Set as default bookmark.”
-
-
Click Save.
Your personalized view—including filters, columns, groupings, and time selections—will be stored for future use.
How to Access a Saved Bookmark
If you did not set your bookmark as the default, here’s how to revisit it later:
-
Click the ribbon icon in the bottom-right of the page. It will now be green.

-
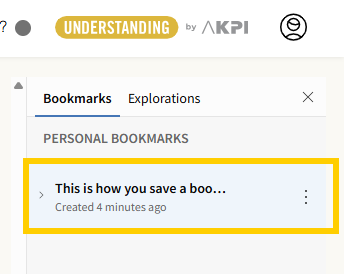
Choose “Manage Bookmarks.”
-
A right-side navigation bar will open showing your saved bookmarks.
-
Select your saved bookmark from the list.
Bookmarks are a powerful way to revisit workflows, replicate reports, or switch between saved perspectives—whether you're analyzing producers, carriers, or time-based trends.
Use Cases
-
Analyze Commission Trends: Select metrics like $ Commission + Fees to measure top revenue-driving lines of business.
-
Assess Producer Performance: Filter by Producer or Account Manager to monitor productivity and revenue contribution.
-
Understand Line of Business Composition: Slice data by Broad LOB or LOB to reveal growth areas or portfolio imbalances.
-
Compare Core vs. Non-Core Carrier Metrics: Easily isolate performance for strategic carrier partnerships.
-
Track Seasonality: Use the time selector and Monthly Details to evaluate how production fluctuates month-to-month or quarter-to-quarter.
-
Audit Transactions by Method: Look at Billing Method or Transaction Type to understand how and when business is processed.
-
Segment by Branch or State: Drill into regional differences in policy count, premium, or net revenue.
Take Action With Precision
Don’t just view the data—use it to fuel action. The Agency Production page is your launchpad to find inefficiencies, highlight successes, and drive targeted growth strategies across every dimension of your agency’s operation.

